Node Replicated Kernel?
Node Replicated Kernel (NRK) is a research prototype OS that started as a project at VMware Research, but is now being developed collaboratively by a team of researchers from industry and academia. It is intended as a basis to explore ideas about the structure of operating systems for hardware of the future. NRK is written from scratch, almost all in Rust (with some assembly), and it runs on x86 platforms.
How is NRK different from Linux, Windows, or MacOS?
At present, NRK lacks many of the features of an operating system that make it usable by anyone other than systems researchers taking measurements of the system itself. For example, there is currently no GUI or Shell, and only very limited application support. In fact, it's probably easier to compare NRK in it's current form to a light-weight hypervisor rather than a fully-featured OS.
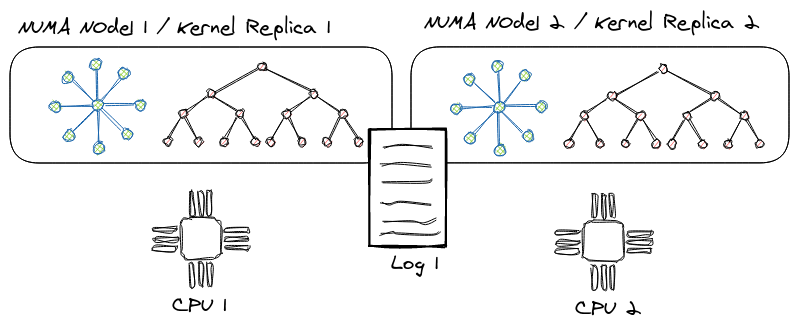
From an architectural point of view, the NRK kernel is a new and practical implementation of a multi-kernel OS:
A multikernel operating system treats a multi-core machine as a network of independent cores, as if it were a distributed system. It does not assume shared memory but rather implements inter-process communications as message-passing.
Unfortunately, such a model also brings unnecessary complexity: For example, the "original" multi-kernel (Barrelfish) relied on per-core communication channels and distributed protocols (2PC, 1PC) to achieve agreement, replication and sharing in the OS.
We overcome this complexity in NRK by using logs: The kernel relies primarily on single-threaded data structures which are automatically replicated in the system. Various operation logs make sure the replicas are always synchronized. Our technique (called node-replication) bears resemblance to state machine replication in distributed systems, and lifts our single-threaded data-structures into linearizable, concurrent structures. Our OSDI'21 paper has more details on scenarios where this approach can heavily outperform the scalability of traditional lock-based or lock-free data-structures.
In user-space, NRK runs applications in ring 3: Each application can be understood as a single isolated process/container/lightweight VM with little opportunity to share state with other processes. To run existing, well-known applications like memcached, LevelDB or Redis, a process can link against rumpkernel, which instantiates and runs the NetBSD kernel and its user-space libraries (libc, libpthread etc.) within the process' address-space and therefore adds decent support for POSIX.
Finally, NRK is written from scratch in Rust: We take advantage of the use of a safe language with a rich type-system for OS implementation, to gain better security and correctness guarantees at compile time, while not impacting performance negatively.
Kernel Architecture
The NRK kernel is a small, light-weight (multi-)kernel that provides a process abstraction with virtual memory, a coarse-grained scheduler, as well as an in-memory file-system.
One key feature of the kernel is how it scales to many cores (and NUMA nodes) by relying on data-structure replication with operation logging. We explain the two main techniques we use for this in the Node Replication and Concurrent Node Replication sections of this chapter.
Node Replication (NR)
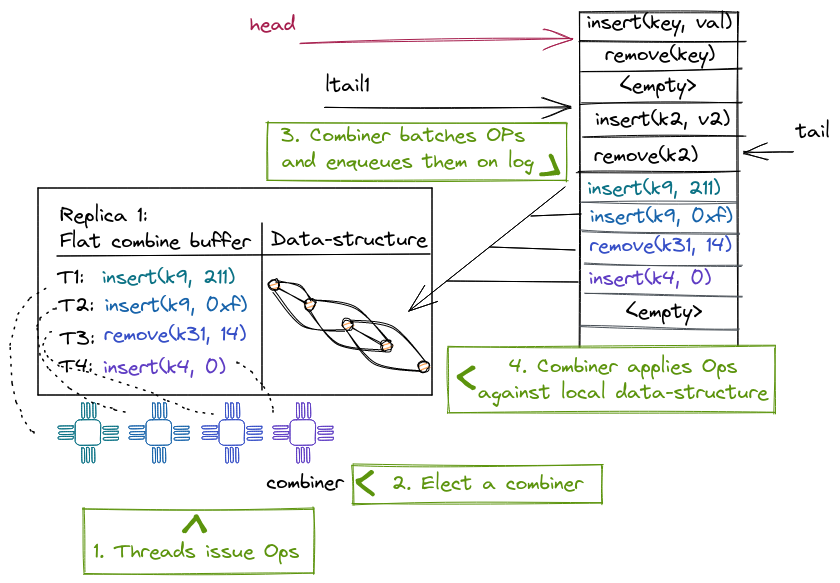
NR creates linearizable NUMA-aware concurrent data structures from black-box sequential data structures. NR replicates the sequential data structure on each NUMA node and uses an operation log to maintain consistency between the replicas. Each replica benefits from read concurrency using a readers-writer lock and from write concurrency using a technique called flat combining. In a nutshell, flat combining batches operations from multiple threads to be executed by a single thread (the combiner). This thread also appends the batched operations to the log; other replicas read the log to update their internal states with the new operations.
Next, we explain in more detail the three main techniques that NR makes use of: operation logs, scalable reader-writer locks and flat combining.
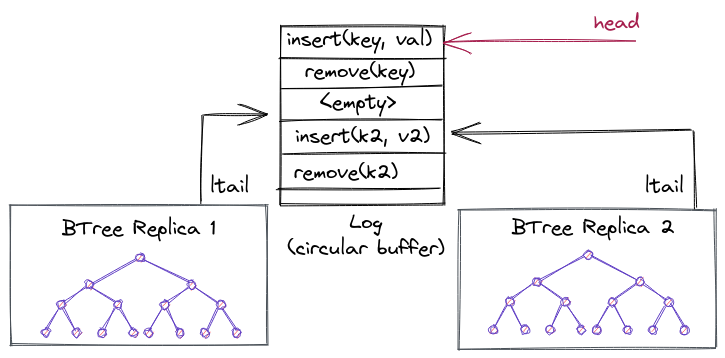
The operation log
The log uses a circular buffer to represent the abstract state of the concurrent data structure. Each entry in the log represents a mutating operation, and the log ensures a total order. The log tail gives the index to the last operation added to the log.
A replica can lazily consume the log by maintaining a per-replica index into the log, indicating how far from the log the replica has been updated. The log is implemented as a circular buffer, so that entries can be garbage collected and reused. NR cannot garbage collect entries that have not been applied on each replica. This means at least one thread on each NUMA node must be executing operations on the data structure, otherwise the log can fill up and other replicas would not be able to make any more progress.
Next, we're going to explain the log in more detail for the curious reader (Warning: if you're not directly working on this, likely these subsections are pretty boring and can be skipped as well).
Log memory layout
The
log
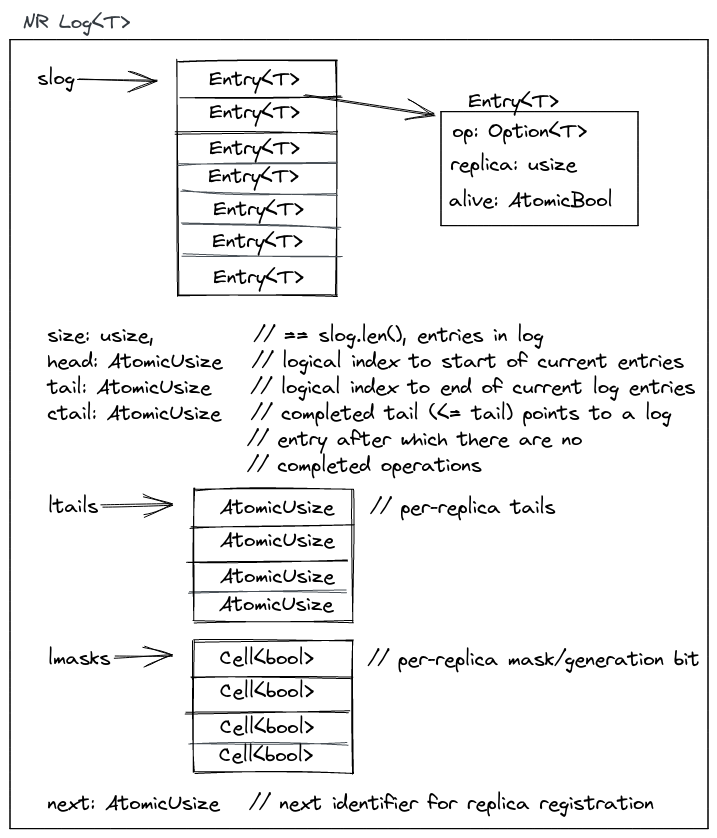
contains an array or slice of entries, slog, where it stores the mutable
operations from the replicas. It also maintains a global head and tail which
are a subregion in slog, and indicate the current operations in the log that
still need to be consumed by at least one replica or have not been garbage
collected by the log. The head points to the oldest "active" entry that still
needs to be processed, and the tail to the newest. All replicas have their own
ltail which tracks per-replica progress. At any point in time, an ltail will
point somewhere in the subregion given by head..tail. lmasks are generation
bits: they are flipped whenever a replica wraps around in the circular buffer.
next is used internally by the library to hand out a registration tokens for
replicas that register with the log (this is done only in the beginning, during
setup). It tracks how many replicas are consuming from/appending to the log.
The ctail is an optimization for reads and tracks the max of all ltails:
e.g., it points to the log entry (< tail) after which there are no completed
operations on any replica yet.
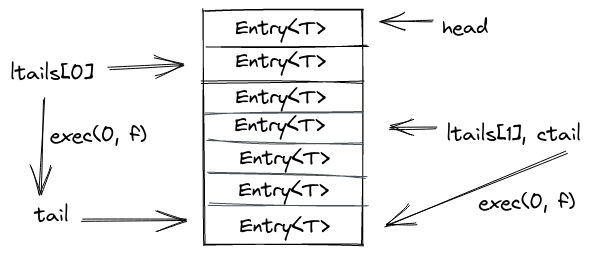
Consuming from the log
The exec
method
is used by replicas to execute any outstanding operations from the log. It takes
a closure that is executed for each outstanding entry, and a token to identify
the replica that calls exec.
Approximately, the method will do two things:
- Invoke the closure for every entry in the log which is in the sub-region
ltail..tailand afterwards setsltail = tail. - Finally, it may update the
ctailifltail > ctailto the new maximum.
Appending to the log
The append
operation
is invoked by replicas to insert mutable operations into the log. It takes a
slice of new operations coming from the replica and the same closure as in
exec to potentially apply some outstanding operations. This is necessary as
the log could be full and unable to insert more operations. Then, we'd first
have to update our own ltail a bit (or wait for other replicas to make
progress).
Approximately, the method will end up doing these steps:
- If there isn't enough space to insert our new batch of operations, try to consume some entries from the log until we have enough space available.
- Do a compare exchange on the log
tailto reserve space for our entries. - Insert entries into the log
- See if we can collect some garbage aka old log entries no longer used (next section).
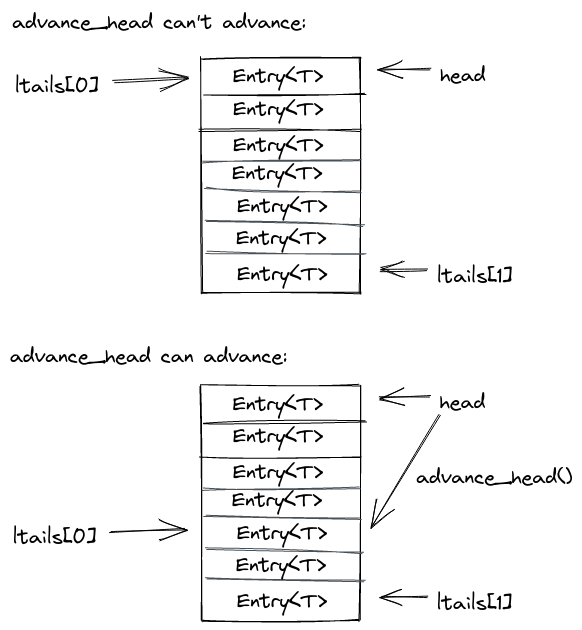
Garbage collecting the log
advance_head
has the unfortunate job to collect the log garbage. Luckily this amounts to as
little as periodically advancing the head pointer.
For that it computes the minium of all ltails. If this minimum still ends up
being the current head, it waits (and calls exec to try and advance its local
tail). Once the min ltail is bigger than the head, it will update the head to
that new minimum ltail and return.
Flat combining
NR uses flat combining to allow threads running on the same socket to share a replica, resulting in better cache locality both from flat combining and from maintaining the replica local to the node's last-level cache.
-
The combiner can batch and combine multiple operations, resulting in a lower overall cost than executing each operation individually. For example, removing items from a priority queue can be done with a single atomic instruction for the whole batch instead of one atomic instruction for each operation.
-
A single thread accesses the data structure for multiple consecutive operations, ensuring cache locality for the whole batch of operations.
NR also benefits from combining operations placed on the log; the combiner does so using a single atomic operation for the whole batch instead of one atomic instruction per operation.
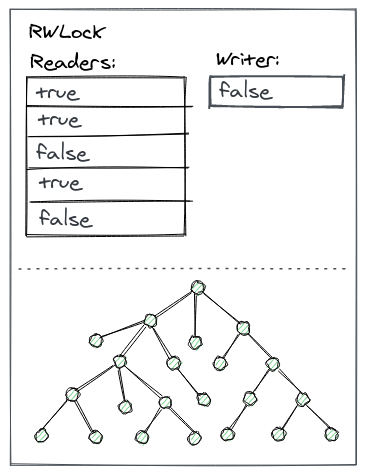
The optimized readers-writer lock
NR uses a writer-preference variant of the distributed RW lock to ensure the correct synchronization of the combiner and reader threads when accessing the sequential replica.
Each reader acquires a local per-thread lock; the writer has its own writer lock to indicate to the readers its intent to acquire the writer lock. A reader first checks the writer lock and then acquires its local lock if there is no writer; then it checks the writer lock again (while holding the lock) and releases the reader lock if it notices the writer declared its intent to acquire the lock (writer preference). The combiner also acquires the writer lock before modifying the replica. Thus, we give highest priority to the writer, because we don't want to delay update operations. This lock allows readers to read a local replica while the combiner is writing a batch of operations to the log, increasing parallelism.
If there is no combiner, a reader might have to acquire the writer lock to update the replica from the log to avoid a stale read, but this situation is rare.
A concurrent non-mutating operation (read)
A non-mutation operation (read) can execute on its thread's local replica, without creating a log entry, but it needs to ensure that the replica is not stale. To do so, it takes a snapshot of the log tail when the operation begins, and waits until a combiner updates the replica past the observed tail, or acquires the lock and updates the replica.
If there is no combiner, the read thread will acquire the writer lock and update the replica.
A concurrent mutating operation (update)
A thread T executing a mutating operation (update) needs to acquire the combiner lock. If the thread T executing this operation fails to acquire it, another thread is a combiner already and T spin-waits to receive its operation's result from the existing combiner.
However, T must still periodically attempt to become the combiner, in case the prior combiner missed T's operation.
If T acquires the lock, it becomes the combiner and executes all update operations of the concurrent threads on the same replica. To do so, T appends its operations to the shared log with a single atomic operation and ensures that the replica is up to date, before executing the operations and returning their results to the waiting threads.
Source and code example
Node-replication (NR) is released as a stand-alone library.
To give an idea, here is an example that transforms an single-threaded hash-table (from the Rust standard library) into a concurrent, replicated hash-table:
#![allow(unused)]
fn main() {
//! A minimal example that implements a replicated hashmap
use std::collections::HashMap;
use node_replication::Dispatch;
use node_replication::Log;
use node_replication::Replica;

/// The node-replicated hashmap uses a std hashmap internally.
#[derive(Default)]
struct NrHashMap {
    storage: HashMap<u64, u64>,
}

/// We support mutable put operation on the hashmap.
#[derive(Clone, Debug, PartialEq)]
enum Modify {
    Put(u64, u64),
}

/// We support an immutable read operation to lookup a key from the hashmap.
#[derive(Clone, Debug, PartialEq)]
enum Access {
    Get(u64),
}

/// The Dispatch traits executes `ReadOperation` (our Access enum)
/// and `WriteOperation` (our `Modify` enum) against the replicated
/// data-structure.
impl Dispatch for NrHashMap {
    type ReadOperation = Access;
    type WriteOperation = Modify;
    type Response = Option<u64>;

    /// The `dispatch` function applies the immutable operations.
    fn dispatch(&self, op: Self::ReadOperation) -> Self::Response {
        match op {
            Access::Get(key) => self.storage.get(&key).map(|v| *v),
        }
    }

    /// The `dispatch_mut` function applies the mutable operations.
    fn dispatch_mut(&mut self, op: Self::WriteOperation) -> Self::Response {
        match op {
            Modify::Put(key, value) => self.storage.insert(key, value),
        }
    }
}
}
As we can see we need to define two operation enums (Modify for mutable
operations that end up on the log, and Access for immutable/read operations).
Afterwards we need to implement the Dispatch trait from NR for our newly
defined data-structure that mainly is responsible to route the operations
defined in Access and Modify to the underlying data-structure. The full
example,
including how to create replicas and a log can be found in the NR repository.
Node Replication (NR)
NR creates linearizable NUMA-aware concurrent data structures from black-box sequential data structures. NR replicates the sequential data structure on each NUMA node and uses an operation log to maintain consistency between the replicas. Each replica benefits from read concurrency using a readers-writer lock and from write concurrency using a technique called flat combining. In a nutshell, flat combining batches operations from multiple threads to be executed by a single thread (the combiner). This thread also appends the batched operations to the log; other replicas read the log to update their internal states with the new operations.
Next, we explain in more detail the three main techniques that NR makes use of: operation logs, scalable reader-writer locks and flat combining.
The operation log
The log uses a circular buffer to represent the abstract state of the concurrent data structure. Each entry in the log represents a mutating operation, and the log ensures a total order. The log tail gives the index to the last operation added to the log.
A replica can lazily consume the log by maintaining a per-replica index into the log, indicating how far from the log the replica has been updated. The log is implemented as a circular buffer, so that entries can be garbage collected and reused. NR cannot garbage collect entries that have not been applied on each replica. This means at least one thread on each NUMA node must be executing operations on the data structure, otherwise the log can fill up and other replicas would not be able to make any more progress.
Next, we're going to explain the log in more detail for the curious reader (Warning: if you're not directly working on this, likely these subsections are pretty boring and can be skipped as well).
Log memory layout
The
log
contains an array or slice of entries, slog, where it stores the mutable
operations from the replicas. It also maintains a global head and tail which
are a subregion in slog, and indicate the current operations in the log that
still need to be consumed by at least one replica or have not been garbage
collected by the log. The head points to the oldest "active" entry that still
needs to be processed, and the tail to the newest. All replicas have their own
ltail which tracks per-replica progress. At any point in time, an ltail will
point somewhere in the subregion given by head..tail. lmasks are generation
bits: they are flipped whenever a replica wraps around in the circular buffer.
next is used internally by the library to hand out a registration tokens for
replicas that register with the log (this is done only in the beginning, during
setup). It tracks how many replicas are consuming from/appending to the log.
The ctail is an optimization for reads and tracks the max of all ltails:
e.g., it points to the log entry (< tail) after which there are no completed
operations on any replica yet.
Consuming from the log
The exec
method
is used by replicas to execute any outstanding operations from the log. It takes
a closure that is executed for each outstanding entry, and a token to identify
the replica that calls exec.
Approximately, the method will do two things:
- Invoke the closure for every entry in the log which is in the sub-region
ltail..tailand afterwards setsltail = tail. - Finally, it may update the
ctailifltail > ctailto the new maximum.
Appending to the log
The append
operation
is invoked by replicas to insert mutable operations into the log. It takes a
slice of new operations coming from the replica and the same closure as in
exec to potentially apply some outstanding operations. This is necessary as
the log could be full and unable to insert more operations. Then, we'd first
have to update our own ltail a bit (or wait for other replicas to make
progress).
Approximately, the method will end up doing these steps:
- If there isn't enough space to insert our new batch of operations, try to consume some entries from the log until we have enough space available.
- Do a compare exchange on the log
tailto reserve space for our entries. - Insert entries into the log
- See if we can collect some garbage aka old log entries no longer used (next section).
Garbage collecting the log
advance_head
has the unfortunate job to collect the log garbage. Luckily this amounts to as
little as periodically advancing the head pointer.
For that it computes the minium of all ltails. If this minimum still ends up
being the current head, it waits (and calls exec to try and advance its local
tail). Once the min ltail is bigger than the head, it will update the head to
that new minimum ltail and return.
Flat combining
NR uses flat combining to allow threads running on the same socket to share a replica, resulting in better cache locality both from flat combining and from maintaining the replica local to the node's last-level cache.
-
The combiner can batch and combine multiple operations, resulting in a lower overall cost than executing each operation individually. For example, removing items from a priority queue can be done with a single atomic instruction for the whole batch instead of one atomic instruction for each operation.
-
A single thread accesses the data structure for multiple consecutive operations, ensuring cache locality for the whole batch of operations.
NR also benefits from combining operations placed on the log; the combiner does so using a single atomic operation for the whole batch instead of one atomic instruction per operation.
The optimized readers-writer lock
NR uses a writer-preference variant of the distributed RW lock to ensure the correct synchronization of the combiner and reader threads when accessing the sequential replica.
Each reader acquires a local per-thread lock; the writer has its own writer lock to indicate to the readers its intent to acquire the writer lock. A reader first checks the writer lock and then acquires its local lock if there is no writer; then it checks the writer lock again (while holding the lock) and releases the reader lock if it notices the writer declared its intent to acquire the lock (writer preference). The combiner also acquires the writer lock before modifying the replica. Thus, we give highest priority to the writer, because we don't want to delay update operations. This lock allows readers to read a local replica while the combiner is writing a batch of operations to the log, increasing parallelism.
If there is no combiner, a reader might have to acquire the writer lock to update the replica from the log to avoid a stale read, but this situation is rare.
A concurrent non-mutating operation (read)
A non-mutation operation (read) can execute on its thread's local replica, without creating a log entry, but it needs to ensure that the replica is not stale. To do so, it takes a snapshot of the log tail when the operation begins, and waits until a combiner updates the replica past the observed tail, or acquires the lock and updates the replica.
If there is no combiner, the read thread will acquire the writer lock and update the replica.
A concurrent mutating operation (update)
A thread T executing a mutating operation (update) needs to acquire the combiner lock. If the thread T executing this operation fails to acquire it, another thread is a combiner already and T spin-waits to receive its operation's result from the existing combiner.
However, T must still periodically attempt to become the combiner, in case the prior combiner missed T's operation.
If T acquires the lock, it becomes the combiner and executes all update operations of the concurrent threads on the same replica. To do so, T appends its operations to the shared log with a single atomic operation and ensures that the replica is up to date, before executing the operations and returning their results to the waiting threads.
Source and code example
Node-replication (NR) is released as a stand-alone library.
To give an idea, here is an example that transforms an single-threaded hash-table (from the Rust standard library) into a concurrent, replicated hash-table:
#![allow(unused)]
fn main() {
//! A minimal example that implements a replicated hashmap
use std::collections::HashMap;
use node_replication::Dispatch;
use node_replication::Log;
use node_replication::Replica;

/// The node-replicated hashmap uses a std hashmap internally.
#[derive(Default)]
struct NrHashMap {
    storage: HashMap<u64, u64>,
}

/// We support mutable put operation on the hashmap.
#[derive(Clone, Debug, PartialEq)]
enum Modify {
    Put(u64, u64),
}

/// We support an immutable read operation to lookup a key from the hashmap.
#[derive(Clone, Debug, PartialEq)]
enum Access {
    Get(u64),
}

/// The Dispatch traits executes `ReadOperation` (our Access enum)
/// and `WriteOperation` (our `Modify` enum) against the replicated
/// data-structure.
impl Dispatch for NrHashMap {
    type ReadOperation = Access;
    type WriteOperation = Modify;
    type Response = Option<u64>;

    /// The `dispatch` function applies the immutable operations.
    fn dispatch(&self, op: Self::ReadOperation) -> Self::Response {
        match op {
            Access::Get(key) => self.storage.get(&key).map(|v| *v),
        }
    }

    /// The `dispatch_mut` function applies the mutable operations.
    fn dispatch_mut(&mut self, op: Self::WriteOperation) -> Self::Response {
        match op {
            Modify::Put(key, value) => self.storage.insert(key, value),
        }
    }
}
}
As we can see we need to define two operation enums (Modify for mutable
operations that end up on the log, and Access for immutable/read operations).
Afterwards we need to implement the Dispatch trait from NR for our newly
defined data-structure that mainly is responsible to route the operations
defined in Access and Modify to the underlying data-structure. The full
example,
including how to create replicas and a log can be found in the NR repository.
Concurrent Node Replication (CNR)
Some OS subsystems can become limited by node-replications (NR) single log if operations are frequently mutating but would otherwise naturally commute.
NR allows multiple combiners from different replicas to make progress in parallel, but its write-scalability is limited because
- all combiner threads are operating on a single, shared log; and
- each replica is a sequential data structure, which requires protection using a readers-writer lock.
To address these problems, we can use CNR, a technique that extends the original NR approach by leveraging operation commutativity present in certain data structures. Two operations are said to be commutative if executing them in either order leaves the data structure in the same abstract state. Otherwise, we say operations are conflicting.
As NR, CNR replicates a data structure across NUMA nodes and maintains the consistency of the replicas. However, CNR uses commutativity to scale the single NR shared log to multiple logs, by assigning commutative operations to different logs, while ensuring that conflicting operations always use the same log and thus have a total order. In addition, CNR can use concurrent or partitioned data structures for replicas, which allows for multiple concurrent combiners on each replica -- one for each shared log. This eliminates the per-replica readers-writer lock and scales access to the data structure.
CNR lifts an already concurrent data structure to a NUMA-aware concurrent data structure. The original data structure can be a concurrent (or partitioned) data structure that works well for a small number of threads (4-8 threads) within a single NUMA node. This data structure can be lock-free or lock-based and may result in poor performance under contention. CNR produces a concurrent data structure that works well for a large number of threads (e.g., 100s of threads) across NUMA nodes, and that is resilient to contention.
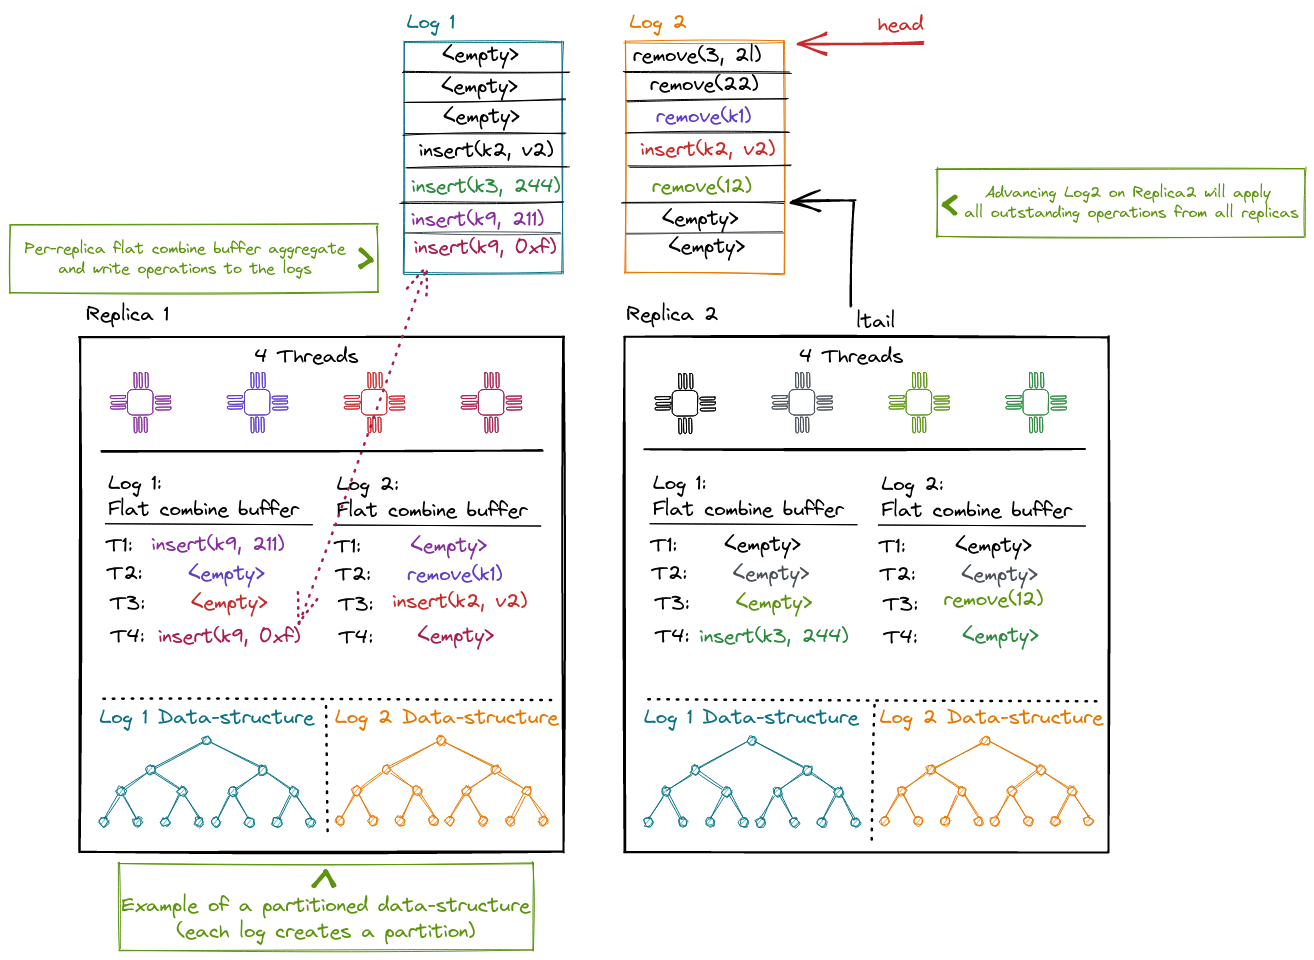
In CNR a replica can distribute commuting operations among different logs. Each replica maintains one flat-combining buffer per log where operations are aggregated. One elected combiner thread commits all outstanding operation in a batch to the log and then applies the ops against the local data-structure.
Compared to NR, the replicated data-structure is no longer protected by a single reader-writer lock by default. Instead, the data-structure can be partitioned (per-log) as in this diagram, use a lock-free approach, or rely on locking.
CNR Operations and Linearizability
CNR is useful for search data structures, with operations insert(x),
remove(x), lookup(x) and range-scan(x, y). These operations often benefit
from commutativity, which depends both on the abstract operation type and on its
input arguments. Similar to transactional
boosting, CNR considers the
abstract data type for establishing commutativity, not the concrete data
structure implementation.
Consider, for example, the insert(x) operation. Two operations are commutative
if they operate on distinct arguments: e.g., insert(x) and insert(y) are
commutative if x != y. A concrete implementation of the data structure could
be a sorted linked list. One might think that insert(x) and insert(x+1) are
not commutative because they operate on shared memory locations. However, the
original data structure already safely orders accesses to shared memory
locations, due to its concurrent nature. Hence, these operations commute for CNR
and can be safely executed concurrently.
Interface
CNR's interface is similar to NR, but it adds operation classes to express commutativity for the mutable and immutable operations. CNR relies on the provided data structure to identify conflicting operations by assigning them to the same operation class. CNR uses this information to allocate conflicting operations to the same shared log and, if they execute on the same NUMA node, to the same combiner too. In contrast, commutative operations can be executed by different combiners and can use different shared logs, allowing them to be executed concurrently.
As with NR, CNR executes different steps for mutating (update) and non-mutating (read) operations. Each of these operations uses only one of the multiple logs and is linearized according to its log's order. Different logs are not totally ordered, but operations belonging to different logs are commutative.
In addition, CNR special-cases another type of operation, scan, which belongs to more than one operation class. These are operations that conflict with many other operations (e.g., a length operation has to read the entire data structure to determine the size). If we assign this operation to a single class, all other operations need to be in the same class, eliminating the commutativity benefit.
Scan-type operations span multiple logs and need a consistent state of the replica across all the logs involved in the operation, obtained during the lifetime of the scan operation. To obtain a consistent state, the thread performing the scan collects an atomic snapshot of the log tails by inserting the operation in these logs. This atomic snapshot becomes the scan's linearization point.
We show the CNR API, with the additional traits implemented for expressing operation classes using our earlier example in the NR section:
#![allow(unused)]
fn main() {
use chashmap::CHashMap;
use cnr::{Dispatch, LogMapper};

/// The replicated hashmap uses a concurrent hashmap internally.
pub struct CNRHashMap {
   storage: CHashMap<usize, usize>,
}

/// We support a mutable put operation on the hashmap.
#[derive(Debug, PartialEq, Clone)]
pub enum Modify {
   Put(usize, usize),
}

/// This `LogMapper` implementation distributes the keys amoung multiple logs
/// in a round-robin fashion. One can change the implementation to improve the
/// data locality based on the data sturucture layout in the memory.
impl LogMapper for Modify {
   fn hash(&self, nlogs: usize, logs: &mut Vec<usize>) {
      debug_assert!(logs.capacity() >= nlogs, "guarantee on logs capacity");
      debug_assert!(logs.is_empty(), "guarantee on logs content");

      match self {
         Modify::Put(key, _val) => logs.push(*key % nlogs),
      }
   }
}

/// We support an immutable read operation to lookup a key from the hashmap.
#[derive(Debug, PartialEq, Clone)]
pub enum Access {
   Get(usize),
}

/// `Access` follows the same operation to log mapping as the `Modify`. This
/// ensures that the read and write operations for a particular key go to
/// the same log.
impl LogMapper for Access {
   fn hash(&self, nlogs: usize, logs: &mut Vec<usize>) {
      debug_assert!(logs.capacity() >= nlogs, "guarantee on logs capacity");
      debug_assert!(logs.is_empty(), "guarantee on logs content");

      match self {
         Access::Get(key) => logs.push(*key % nlogs),
      }
   }
}

/// The Dispatch traits executes `ReadOperation` (our Access enum)
/// and `WriteOperation` (our Modify enum) against the replicated
/// data-structure.
impl Dispatch for CNRHashMap {
   type ReadOperation = Access;
   type WriteOperation = Modify;
   type Response = Option<usize>;

   /// The `dispatch` function applies the immutable operations.
   fn dispatch(&self, op: Self::ReadOperation) -> Self::Response {
       match op {
           Access::Get(key) => self.storage.get(&key).map(|v| *v),
       }
   }

   /// The `dispatch_mut` function applies the mutable operations.
   fn dispatch_mut(&self, op: Self::WriteOperation) -> Self::Response {
       match op {
           Modify::Put(key, value) => self.storage.insert(key, value),
       }
   }
}
}
CNR is available as a stand-alone rust library together with the NR code on github.
Comparison to NR and Notation
CNR benefits from the NR techniques, such as flat combining and operation logs with a succinct operation description, which reduce contention and inter-NUMA synchronization.
As NR, CNR has two drawbacks: increased memory footprint and increased computational cost from re-executing each operation on each replica. CNR has similar footprint to NR, because the single shared log can be split into multiple, smaller shared logs. However, CNR increases parallelism within each NUMA node by using a concurrent replica with multiple combiners and increases parallelism across NUMA nodes by using multiple (mostly) independent shared logs.
Memory
Kernel address space
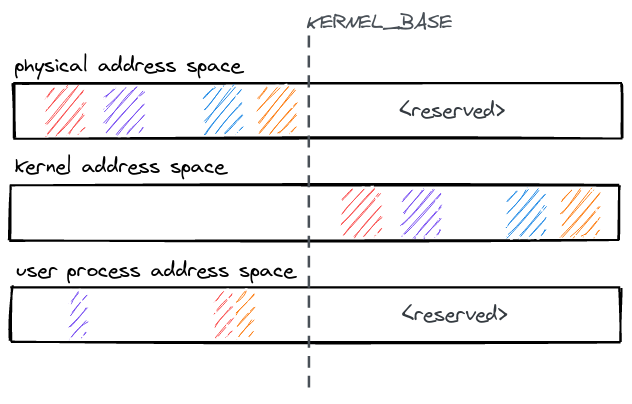
The kernel address space layout follows a simple scheme: All physical memory is
identity mapped with a constant offset KERNEL_BASE in the kernel address
space. Therefore, any physical address can be accessed in the kernel by adding
KERNEL_BASE to it.
All physical memory is always accessible in the kernel and does not need to
mapped/unmapped at runtime. The kernel binary is linked as position independent
code, it is loaded into physical memory and then relocated to run at the kernel
virtual address (KERNEL_BASE + physical address).
Physical memory
Physical memory allocation and dynamic memory allocation for kernel data structures are two basic subsystems that do not rely on NR. Replicated subsystems often require physical frames, but that allocation operation itself should not be replicated. For example, when installing a mapping in a page table, each page table entry should refer to the same physical page frame on all replicas (though, each replica should have its own page tables). If allocator state were replicated, each allocation operation would be repeated on each replica, breaking this.
At boot time, the affinity for memory regions is identified, and memory is divided into per-NUMA node caches (FrameCacheLarge). The FrameCacheLarge statically partitions memory further into two classes of 4 KiB and 2 MiB frames. Every core has a local FrameCacheSmall of 4 KiB and 2 MiB frames for fast, no-contention allocation when it contains the requested frame size. If it is empty, it refills from its local FrameCacheLarge. Similar to slab allocators, NRK' FrameCacheSmall and FrameCacheLarge implement a cache frontend and backend that controls the flow between TCaches and NCaches.

Dynamic memory
Since NRK is implemented in Rust, memory management is greatly simplified by relying on the compiler to track the lifetime of allocated objects. This eliminates a large class of bugs (use-after-free, uninitialized memory etc.), but the kernel still has to explicitly deal with running out of memory. NRK uses fallible allocations and intrusive data structures to handle out-of-memory errors gracefully.
The dynamic memory allocator in nrk provides an implementation for the Rust global allocator interface. It uses size classes and different allocators per class (e.g., it's a segregated-storage allocator), while incorporating some of the simple and effective ideas from slab allocation: For each size class, 2MiB or 4 KiB frames are used which are sliced into equal sized objects of a given class. A bitfield at the end of every frame tracks the meta-data for objects within the frame (e.g., to determine if its allocated or not).

Deterministic memory
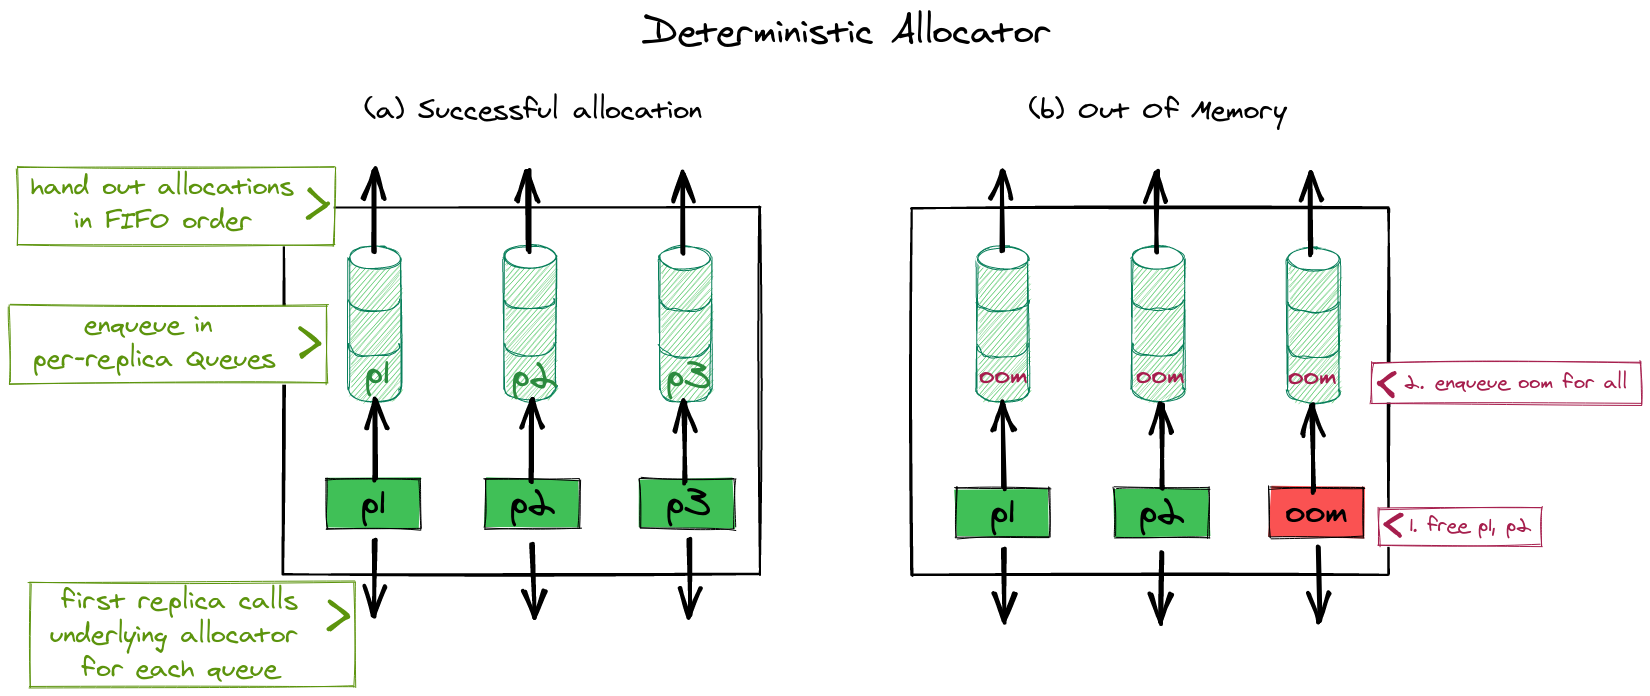
The kernel has to explicitly handle running out of memory. nrk uses fallible allocations to handle out-of-memory errors gracefully by returning an error to applications. We do this in almost all cases in the kernel (with some exceptions during initializations etc.) but some of the 3rd party dependencies (e.g., to parse ELF binaries) are not completely converted to fallible allocations yet.
Another issue is that handling out-of-memory errors in presence of replicated data-structures becomes a little more challenging: Allocations which happen to store replicated state must be deterministic (e.g. they should either succeed on all replicas or none). Otherwise, the replicas would end up in an inconsistent state if after executing an operation, some replicas had successful and some had unsuccesful allocations. Making sure that all replicas always have equal amounts of memory available is infeasible because every replica replicates at different times and meanwhile allocations can happen on other cores for unrelated reasons. We solve this problem in nrk by requiring that all memory allocations for state within NR or CNR must go through a deterministic allocator. In the deterministic allocator, the first replica that reaches an allocation request allocates memory on behalf of all other replicas too. The deterministic allocator remembers the results temporarily, until they are picked up by the other replicas which are running behind. If an allocation for any of the replica fails, the leading replica will enqueue the error for all replicas, to ensure that all replicas always see the same result. Allocators in nrk are chainable and it is sufficient for the deterministic allocator to be anywhere in the chain so it doesn't necessarily have to be invoked for every fine-grained allocation request. Our implementation leverages custom allocators in Rust, which lets us override which heap allocator is used for individual data-structures.
Process structure
Virtual memory
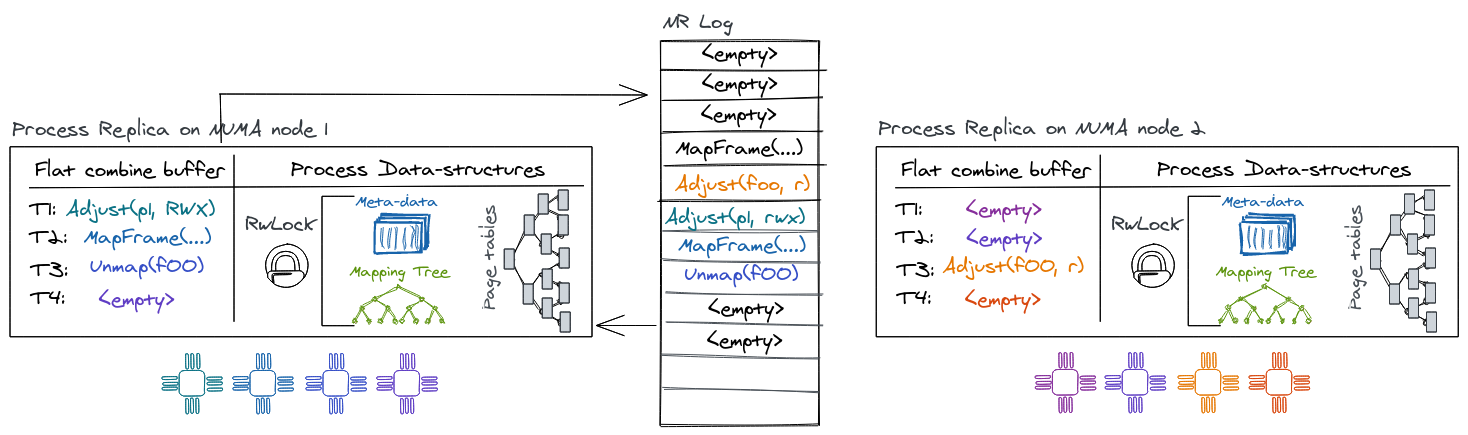
NRK relies on the MMU for isolation. Like most conventional virtual memory implementations, NRK uses a per-process mapping database (as a B-Tree) to store frame mappings which is used to construct the process's hardware page tables. NRK currently does not support demand paging. Both the B-Tree and the hardware page tables are simple, sequential data structures that are wrapped behind the NR interface for concurrency and replication.
Therefore, the mapping database and page tables are replicated on every NUMA
node, forming the biggest part of the process abstraction. A process exposes the
following mutating operations to modify its address space: MapFrame (to
insert a mapping); Unmap (to remove mappings); and Adjust (to change
permissions of a mapping). The virtual memory system also supports a
non-mutating Resolve operation (that advances the local replica and queries
the address space state).
Virtual memory and NR
There are several aspects of the virtual-memory design that are influenced by its integration with NR:
For example, the virtual-memory has to consider out-of-band read accesses by
cores' page table walkers. Normally a read operation would go through the NR
interface, ensuring replay of all outstanding operations from the log first.
However, a hardware page table walker does not have this capability. A race
arises if a process maps a page on core X of replica A and core Y of replica B
accesses that mapping in userspace before replica B has applied the update.
Luckily, this can be handled since it generates a page fault. In order to
resolve this race, the page-fault handler advances the replica by issuing a
Resolve operation on the address space to find the corresponding mapping of
the virtual address generating the fault. If a mapping is found, the process can
be resumed since the Resolve-operation will apply outstanding operations. If
no mapping is found, the access was an invalid read or write by the process.
Unmap or Adjust (e.g., removing or modifying page-table entries) requires
the OS to flush TLB entries on cores where the process is active to ensure TLB
coherence. This is typically done in software, by the OS, and commonly referred
to as performing a TLB shootdown. The initiator core will start by enqueuing the
operation for the local replica. After NR returns we know that the unmap (or
adjust) operation has been performed at least against the local page-table
replica and is enqueued as a future operation on the log for other replicas.
Next, we send inter-processor interrupts (IPIs) to trigger TLB flushes on all
cores running the corresponding process. As part of the IPI handler the cores
will first acknowledge the IPI to the initiator, next they must make sure to
advance their local replica with outstanding log operations (which forces the
unmap/adjust if not already applied), then poll a per-core message queue to get
information about the regions that need to be flushed, and finally perform the
TLB invalidation. Meanwhile the initiator will invalidate its own TLB entries
and then wait for all outstanding acknowledgments from other cores before it can
return to user-space.
Scheduler
In NRK, the kernel-level scheduler is a coarse-grained scheduler that allocates CPUs to processes. Processes make system calls to request for more cores and to give them up. The kernel notifies processes core allocations and deallocations via upcalls. To run on a core, a process allocates executor objects (i.e., the equivalent of a "kernel" thread) that are used to dispatch a given process on a CPU. An executor mainly consists of two userspace stacks (one for the upcall handler and one for the initial stack) and a region to save CPU registers and other metadata. Executors are allocated lazily but a process keeps a per-NUMA node cache to reuse them over time.
In the process, a userspace scheduler reacts to upcalls indicating the addition or removal of a core, and it makes fine-grained scheduling decisions by dispatching threads accordingly. This design means that the kernel is only responsible for coarse-grained scheduling decisions, and it implements a global policy of core allocation to processes.
The scheduler uses a sequential hash table wrapped with NR to map each process id to a process structure and to map process executors to cores. It has operations to create or destroy a process; to allocate and deallocate executors for a process; and to obtain an executor for a given core.
File System
The NrFS is a simple, in-memory file system in nrk that supports some POSIX file
operations (open, pread, pwrite, close, etc.).
NrFS tracks files and directories by mapping each path to an inode number and then mapping each inode number to an in-memory inode. Each inode holds either directory or file metadata and a list of file pages. The entire data structure is wrapped by CNR for concurrent access and replication.
User Space
The main user-space components are explained in more details in this chapter.
KPI: Kernel Public Interface
The Kernel Public Interface (KPI) is the lowest level user-space library that an application links with. As the name suggests it is the common interface definition between the kernel and user-space programs. It is special because it is the only library that is shared between user and kernel code.
The KPI contains the syscall interface and various struct definitions that are exchanged between the kernel and user-space. If in the future, we care about ABI compatibility, we would not try to keep the syscall ABI compatible but would rather enforce compatibility at the KPI boundary.
Typically, the KPI functionality will rarely be accessed directly by an
application. Instead, many parts of it are re-exported or wrapped by the
vibrio library OS. The kpi code is found in lib/kpi.
Lineup
Lineup is a user-space, cooperative thread scheduler that runs green-threads
(user-level threads). It supports many synchronization primitives (mutex,
rwlock, conditional variables, barriers etc.), thread-local storage, and has
some basic support for multi-threading. It uses
fringe for compiler-assisted
context-switching. The scheduler code is found in lib/lineup.
Upcalls
The kernel can notify the scheduler about events through an up-call mechanism, for example to notify about more available cores (or removal of cores), to forward device interrupts, or page-faults from kernel to user-space.
The mechanism for this is inspired by scheduler activations: The kernel and user-space program agree on a common save area to store a CPU context (on a per-core basis). If an event arrives at the kernel, it will save the current CPU context (registers etc.) in the agreed upon save-area and resume the process with a new (mostly empty) context that invokes the pre-registered upcall handler instead. The upcall handler gets all information about the event that triggered the interruption through function arguments so it can then take appropriate measures to react. After the event is handled, the upcall handler can read the previous context (from before the interruption) from the common save area and decide to resume where computation left off before the upcall (or decide not to continue with this context).
Vibrio
Virbio is the user-space library that provides most of the functionality
necessary to run applications in user-space. It is found in lib/vibrio.
Memory
The user-space memory manager provides a malloc and free like interface for
C code and a GlobalAlloc implementation for rust programs. We rely on the
same allocator that the kernel
uses for small--medium sized blocks (between 0 and 2 MiB). Everything else is
mapped directly by allocating memory with the map syscall.
RumpRT
A rumpkernels is a componentized NetBSD kernel that can run in many different environments. It contains file systems, a POSIX system call interface, many PCI device drivers, a SCSI protocol stack, virtio, a TCP/IP stack, libc and libpthread and more.
Vibrio has a rumprt module which provides the necessary low-level interface to
run a rumpkernel inside a user-space process (e.g., the
rumpuser API and some more). This has the
advantage that it's possible to run many POSIX compatible programs out of the
box without building a fully-fledged POSIX compatibility layer into NrOS.
- Bare-metal and Xen implementations for rumprun
- Some supported applications
- PhD thesis about rumpkernels
Vibrio dependency graph
Vibrio uses the following crates / dependencies:
vibrio
├── arrayvec
├── bitflags
├── crossbeam-utils
├── cstr_core
├── hashbrown
├── kpi
├── lazy_static
├── lineup
├── log
├── rawtime
├── rumpkernel
├── serde_cbor
├── slabmalloc
├── spin
└── x86
rkapps
The rkapps directory (in usr/rkapps) is an empty project aside from the
build.rs file. The build file contains the steps to clone and build a few
different well-known programs (memcached, LevelDB, Redis etc.) that we use to
test user-space and rumprt.
The checked-out program sources and binaries are placed in the following location as part of your build directory:
target/x86_64-nrk-none/<debug | release>/build/rkapps-$HASH/out/
The build for these programs can be a bit hard to understand. The following steps happen:
- Clone the packages repo which has build instructions for different POSIX programs running on rumpkernels.
- For each application that we want to build (enabled/disabled by feature
flags): Run
makein the respective directory. This will compile the application with the appropriate rumpkernel toolchain. The toolchain be found in a similar path inside the build directory:target/x86_64-nrk-none/<debug | release>/build/rumpkernel-$HASH - Linking binaries with vibrio which provides the low-level runtime for rumpkernels.
For more information on how to run rkapps applications, refer to the Benchmarking section.
Development
This chapter should teach you how to Build, Run, Debug, Test and Trace the OS.
Configuration
Some tips and pointers for setting up and configuring the development environment.
VSCode
VSCode generally works well for developing nrk. The rust-analyzer plugin is
preferred over rls which often has build issues due to the project not having
a std runtime (no-std).
Git
For first time git users or new accounts, you'll have to configure your username and email:
git config --global user.name "Gerd Zellweger"
git config --global user.email "mail@gerdzellweger.com"
To have better usability when working with submodules, you can configure git to
update submodules automatically when doing a git pull etc.
git config --global submodule.recurse true
Fetch multiple submodules in parallel:
git config --global submodule.fetchJobs 20
We don't allow merge requests on master, to always keep a linear history. The following alias can be helpful:
[alias]
    purr = pull --rebase
Adding a new submodule to the repository
cd libgit submodule add <path-to-repo> <foldername>
Removing a submodule in the repository
- Delete the relevant section from the .gitmodules file.
- Stage the .gitmodules changes:
git add .gitmodules. - Delete the relevant section from .git/config.
- Run
git rm --cached path_to_submodule(no trailing slash). - Run
rm -rf .git/modules/path_to_submodule(no trailing slash). - Commit changes
Styleguide
Code format
We rely on rustfmt to automatically format our code.
Code organization
We organize/separate imports into three blocks (all separated by one newline):
- 1st block for core language things:
core,alloc,stdetc. - 2nd block for libraries:
vibrio,x86,lazy_staticetc. - 3rd block for internal imports:
crate::*,super::*etc. - 4th block for re-exports:
pub(crate) use::*etc. - 5th block for modules:
mod foo;etc.
Afterwards a .rs file should (roughly) have the following structure:
- 1st
typedeclarations - 2nd
constdeclarations - 3rd
staticdeclarations - 4th
struct,fn,impletc. declarations
Visibility
Avoid the use of pub in the kernel. Use pub(crate), pub(super) etc. This
helps with dead code elimination.
Assembly
We use AT&T syntax for assembly code (options(att_syntax) in Rust asm!
blocks)
Cargo features
Libraries and binaries only have non-additive / non-conflicting feature flags.
This helps to spot compilation problems quickly (e.g. with cargo build --all-features)
Errors
The KError type is used to represent errors in the kernel. Whenever possible,
each variant should only be used once/in a single location (to be easy to grep
for) and should have a descriptive name.
Formatting Commit Messages
We follow the conventions on How to Write a Git Commit Message.
Be sure to include any related GitHub issue references in the commit message. See GFM syntax for referencing issues and commits.
Github pull requests & history
Since github doesn't do fast-forward merges through the UI, after PR passes test, merge it on the command line to keep the same commit hashes of the branch in master:
git checkout master
git merge --ff-only feature-branch-name
Building
There are two sets of dependencies required for the development process: build and run dependencies. We typically build, develop and test using the latest Ubuntu LTS version and run nrk in QEMU. Other Linux systems will probably work but might require a manual installation of all dependencies. Other operating systems likely won't work out of the box without some adjustments for code and the build-process.
Check-out the source tree
Check out the nrk sources first:
git clone <repo-url>
cd nrk
The repository is structured using git submodules. You'll have to initialize and check-out the submodules separately:
In case you don't have the SSH key of your machine registered with a github account, you need to convert all submodule URLs to use the https protocol instead of SSH, to do so run this sed script before proceeding:
sed -i'' -e 's/git@github.com:/https:\/\/github.com\//' .gitmodules
git submodule update --init
Dependencies
If you want to build without Docker, you
can install both build and run dependencies by executing setup.sh in the root
of the repository directly on your machine (this requires the latest Ubuntu
LTS). The script will install all required OS packages, install Rust using
rustup and some additional rust programs and
dependencies. To run rackscale integration tests, you will also have to install
the DCM-based scheduler dependencies.
The build dependencies can be divided into these categories
- Rust (nightly) and the
rust-srccomponent for compiling the OS python3(and some python libraries) to execute the build and run script- Test dependencies (qemu, corealloc, dhcpd, redis-benchmark, socat, graphviz etc.)
- Rumpkernel dependencies (gcc, zlib1g etc.)
- Build for documentation (mdbook)
See scripts/generic-setup.sh function install_build_dependencies for
details.
Use Docker
We provide scripts to create a docker image which contains all build dependencies already.
To use Docker, it needs to be installed in your system. On Ubuntu execute the following steps:
sudo apt install docker.io
sudo service docker restart
sudo addgroup $USER docker
newgrp docker
To create the image execute the following command in the /scripts directory.
bash ./docker-run.sh
This will create the docker image and start the container. You will be dropped into a shell running inside the Docker container. You can build the OS as if you had installed the dependencies natively.
The script will create a user inside the docker container that corresponds to the user on the host system (same username and user ID).
You can rebuild the image with:
bash ./docker-run.sh force-build
To exit the container, just type exit to terminate the shell.
Build without running
To just build the OS invoke the run.py script (in the kernel directory) with
the -n parameter (no-run flag).
python3 kernel/run.py -n
If you want to run the build in a docker container, run bash ./scripts/docker-run.sh beforehand. The source directory tree will be mounted
in the docker container in /source.
Using run.py
The kernel/run.py script provides a simple way to build, deploy and run the
system in various settings and configuration. For a complete set of parameters
and config options refer to the run.py --help instructions.
As an example, the following invocation
python3 run.py --kfeatures test-userspace --cmd='log=info init=redis.bin' --mods rkapps init --ufeatures rkapps:redis --machine qemu --qemu-settings='-m 1024M' --qemu-cores 2
will
- compile the kernel with Cargo feature
test-userspace - pass the kernel the command-line arguments
log=info init=redis.binon start-up (sets logging to info and starts redis.bin for testing) - Compile two user-space modules
rkapps(with cargo feature redis) andinit(with no features) - Deploy and run the compiled system on
qemuwith 1024 MiB of memory and 2 cores allocated to the VM
If Docker is used as build environment, it is necessary to first compile the system with the required features inside the Docker container:
python3 run.py --kfeatures test-userspace --mods rkapps init --ufeatures rkapps:redis -n
Afterwards, the aforementioned command can be used to run NRK outside the
Docker container with the given configuration. The run.py script will
recognize that the system has already been build and will directly start
qemu.
Sometimes it's helpful to know what commands are actually executed by run.py.
For example to figure out what the exact qemu command line invocation was. In
that case, --verbose can be supplied.
Depending on the underlying system configuration NRK may abort because a connection to the local network can not be established. In this case, the following steps can help to resolve this issue:
- Disable AppArmor. Detailed instructions can be found here.
- Manually start the DHCP server immediately after NRK has started:
sudo dhcpd -f -d tap0 --no-pid -cf ./kernel/tests/dhcpd.conf
Baremetal execution
The kernel/run.py script supports execution on baremetal machines with
the --machine argument:
python3 run.py --machine b1542 --verbose --cmd "log=info"
This invocation will try to run nrk on the machine described by a
b1542.toml config file.
A TOML file for a machine has the following format:
[server]
# A name for the server we're trying to boot
name = "b1542"
# The hostname, where to reach the server
hostname = "b1542.test.com"
# The type of the machine
type = "skylake2x"
# An arbitrary command to set-up the PXE boot enviroment for the machine
# This often involves creating a hardlink of a file with a MAC address
# of the machine and pointing it to some pxe boot directory
pre-boot-cmd = "./pxeboot-configure.sh -m E4-43-4B-1B-C5-DC -d /home/gz/pxe"

# run.py support only booting machines that have an idrac management console:
[idrac]
# How to reach the ilo/iDRAC interface of the machine
hostname = "b1542-ilo.test.com"
# Login information for iDRAC
username = "user"
password = "pass"
# Serial console which we'll read from
console = "com2"
# Which iDRAC version we're dealing with (currently unused)
idrac-version = "3"
# Typical time until machine is booted
boot-timeout = 320

[deploy]
# Server where binaries are deployed for booting with iPXE
hostname = "ipxe-server.test.com"
username = "user"
ssh-pubkey = "~/.ssh/id_rsa"
# Where to deploy kernel and user binaries
ipxe-deploy = "/home/gz/public_html/"
An iPXE environment that the machine will boot from needs to be set-up. The iPXE bootloader should be compiled with UEFI and ELF support for running with nrk.
Note that the current support for bare-metal execution is currently limited to DELL machines with an iDRAC management console (needed to reboot the server). Ideally, redfish or SNMP support will be added in the future.
Compiling the iPXE bootloader
TBD.
Debugging
Currently the debugging facilities are not as good as on a production operating
systems. However, there are some options available: gdb, printf-style
debugging, logging and staring at code. We will discuss the options in this
chapter.
GDB support in the kernel
tldr: To use gdb, add
--kgdbtorun.py.
NRK provides an implementation for the gdb remote protocol using a separate serial line for communication. This means you can use gdb to connect to the running system.
To use it, start run.py with the --kgdb argument. Once booted, the following
line will appear:
Waiting for a GDB connection on I/O port 0x2f8...
Use `target remote localhost:1234` in gdb session to connect
Next, connect with GDB to the kernel, using:
$ cd kernel
$ gdb ../target/x86_64-uefi/<debug | release>/esp/kernel
[...]
(gdb) target remote localhost:1234
Remote debugging using localhost:1234
[...]
If you execute gdb in the kernel directory, the
.gdbinitfile there already executestarget remote localhost:1234for you. But you have to add the kernel directory as a "trusted" path by adding this line to$HOME/.gdbinit:add-auto-load-safe-path <REPO-BASE>/kernel/.gdbinit
The GDB dashboard works as well,
just insert target remote localhost:1234 at the top of the .gdbinit file.
Breakpoints
tldr: use
breakorhbreakin gdb.
Currently the maximum limit of supported breakpoints (and watchpoints) is four.
Why? Because we use the x86-64 debug registers for breakpoints and there are only 4 such registers. Our gdb stub implements both software and hardware breakpoints with the debug registers.
An alternative technique would be to either insert int3 into .text for
software interrupts (or let gdb do it automatically if software interrupts are
marked as not supported by the stub). However, this is a bit more complicated
because we need to prevent cascading breakpoints (e.g., the debug interrupt
handler should ideally not hit a breakpoint while executing). With only debug
registers, this is fairly easy to achieve, as we just have disable them on entry
and re-enable them when we resume, whereas the int3 approach would involve
patching/reverting a bunch of .text offsets. On the plus side it would enable
an arbitrary amount of breakpoints if this ever becomes necessary.
Watchpoints
Again the maximum limit is four watchpoints (and breakpoints) at the same time.
Use watch -l <variable> to set a watchpoint. The -l option is important
because it watches the memory location of the variable/expression rather than
the expression. Normal watch is not supported as gdb may try to overwrite
.text locations (which are mapped only as read-execute) in the kernel.
printf debugging with the log crate
Here are a few tips:
- Change the log-level of the kernel to info, debug, or even trace:
python3 run.py --cmd='log=info' - Logging can also be enabled per-module basis. For example, to enable trace
output for just the
gdbstublibrary and thegdbmodule in the kernel this is how the necessary--cmdinvocation forrun.pywould look like:--cmd "log='gdbstub=trace,nrk::arch::gdb=trace'" - Change the log-level of the user-space libOS in vibrio (search for
Level::) - Make sure the Tests run (to see if something broke).
Figuring out why things failed
Maybe you'll encounter failures, for example like this one:
[IRQ] GENERAL PROTECTION FAULT: From Any memory reference and other protection checks.
No error!
Instruction Pointer: 0x534a39
ExceptionArguments { vec = 0xd exception = 0x0 rip = 0x534a39, cs = 0x23 rflags = 0x13206 rsp = 0x5210400928 ss = 0x1b }
Register State:
Some(SaveArea

rax =                0x0 rbx =                0x0 rcx =                0x0 rdx =                0x0
rsi =                0x0 rdi =       0x5210400a50 rbp =       0x5210400958 rsp =       0x5210400928
r8  =                0x2 r9  =       0x5202044c00 r10 =                0x3 r11 =           0x28927a
r12 =       0x520e266810 r13 =           0x7d8ac0 r14 =           0x6aaaf9 r15 =           0x686680
rip =           0x534a39 rflags = FLAGS_RF | FLAGS_IOPL1 | FLAGS_IOPL2 | FLAGS_IOPL3 | FLAGS_IF | FLAGS_PF | FLAGS_A1)
stack[0] = 0x5210400958
stack[1] = 0x53c7fd
stack[2] = 0x0
stack[3] = 0x0
stack[4] = 0x0
stack[5] = 0x0
stack[6] = 0x52104009b8
stack[7] = 0x534829
stack[8] = 0x5210400a50
stack[9] = 0x5210400a50
stack[10] = 0x0
stack[11] = 0x268
The typical workflow to figure out what went wrong:
- Generally, look for the instruction pointer (
ripwhich is0x534a39in our example). - If the instruction pointer (and
rspandrbp) is below kernel base, we were probably in user-space when the failure happened (you can also determine it by looking at cs/ss but it's easier to tell from the other registers). - Determine exactly where the error happened. To do this, we need to find the
right binary which was running. Those are usually located in
target/x86_64-uefi/<release|debug>/esp/<binary>. - Use
addr2line -e <path to binary> <rip>to see where the error happened. - If the failure was in kernel space, make sure you adjust any addresses by
substracting the PIE offset where the kernel binary was executing in the
virtual space. Look for the following line
INFO: Kernel loaded at address: 0x4000bd573000, it's printed by the bootloader early during the boot process. Substract the printed number to get the correct offset in the ELF file. - Sometimes
addr2linedoesn't find anything, it's good to check with objdump, which also gives more context:objdump -S --disassemble --demangle=rustc target/x86_64-uefi/<release|debug>/esp/<binary> | less - The function that gets reported might not be useful (e.g., if things fail in
memcpy). In this case, look for addresses that could be return addresses on the stack dump and check them too (e.g.,0x534829looks suspiciously like a return address). - If all this fails, something went wrong in a bad way, maybe best to go back to printf debugging.
Always find the first occurrence of a failure in the serial log. Because our backtracing code is not very robust, it still quite often triggers cascading failures which are not necessarily relevant.
Debugging rumpkernel/NetBSD components
nrk user-space links with a rather large (NetBSD) code-base. When things go wrong somewhere in there, it's sometimes helpful to temporarily change or get some debug output directly in the C code.
You can edit that code-base directly since it gets checked out and built in the
target directory. For example, to edit the rump_init function, open the file
in the rumpkern folder of the NetBSD source here:
target/x86_64-nrk-none/release/build/rumpkernel-$HASH/out/src-netbsd/sys/rump/librump/rumpkern/rump.c
Make sure to identify the correct $HASH that is used for the build if you find
that there are multiple rumpkernel-* directories in the build dir, otherwise
your changes won't take effect.
After you're done with edits, you can manually invoke the build, and launch the OS again.
As a simple example you can search for rump_init(void) in
target/x86_64-nrk-none/release/build/rumpkernel-$HASH/out and add a printf
statement there, then the following steps should ensure the print also appears
on the console:
cd target/x86_64-nrk-none/release/build/rumpkernel-$HASH/out
./build-rr.sh -j24 nrk -- -F "CFLAGS=-w"
# Delete ../target/x86_64-nrk-none/debug/build/init-* to force rebuild of init...
# Invoke run.py again...
If you change the compiler/rustc version, do a clean build, or delete the target directory your changes might be overridden as the sources exist only inside the build directory (
target). It's a good idea to save changes somewhere for safekeeping if they are important.
Debugging in QEMU/KVM
If the system ends up in a dead-lock, you might be able to get a sense of where things went south by asking qemu. Deadlocks with our kernel design are rare, but in user-space (thanks to locking APIs) it can definitely happen.
The following steps should help:
- Add
--qemu-monitorto the run.py invocation to start the qemu monitor. - Connect to the monitor in a new terminal with
telnet 127.0.0.1 55555. - You can use
info registers -ato get a dump of the current register state for all vCPUs or any other command to query the hypervisor state. - If you're stuck in some loop, getting a couple register dumps might tell you
more than invoking
info registersjust once.
When developing drivers that are emulated in qemu, it can be useful to enable
debug prints for the interface in QEMU to see what state the device is in. For
example, to enable debug output for vmxnet3 in the sources, you can change the
#undef statements in hw/net/vmxnet_debug.h to #define and recompile the
qemu sources (your changes should look similar to this snippet below):
#define VMXNET_DEBUG_CB
#define VMXNET_DEBUG_INTERRUPTS
#define VMXNET_DEBUG_CONFIG
#define VMXNET_DEBUG_RINGS
#define VMXNET_DEBUG_PACKETS
#define VMXNET_DEBUG_SHMEM_ACCESS
Testing
If you've found and fixed a bug, we better write a test for it. nrk uses several test-frameworks and methodologies to ensure everything works as expected:
- Regular unit tests: Those can be executed running
cargo testin the project folder. Sometimes addingRUST_TEST_THREADS=1is necessary due to the structure of the runner/frameworks used. This should be indicated in the individual READMEs. - A slightly more exhaustive variant of unit tests is property based testing. We use proptest to make sure that the implementation of kernel sub-systems corresponds to a reference model implementation.
- Integration tests are found in the kernel, they typically launch a qemu instance and use rexpect to interact with the guest.
- Fuzz testing: TBD.
Running tests
To run the unit tests of the kernel:
cd kernelRUST_BACKTRACE=1 RUST_TEST_THREADS=1 cargo test --bin nrk
To run the integration tests of the kernel:
cd kernelRUST_TEST_THREADS=1 cargo test --test '*'
If you would like to run a specific integration test you can pass it with --:
RUST_TEST_THREADS=1 cargo test --test '*' -- userspace_smoke
If you would like to run a specific set of integration tests, you can specify the file name with --test:
RUST_TEST_THREADS=1 cargo test --test s00_core_tests
In case an integration test fails, adding --nocapture at the end (needs to
come after the --) will make sure that the underlying run.py invocations are
printed to the stdout. This can be helpful to figure out the exact run.py
invocation that a test is doing so you can invoke it yourself manually for
debugging.
Parallel testing for he kernel is not possible at the moment due to reliance on build flags for testing.
The commitable.sh script automatically runs the unit and integration tests:
cd kernel
bash commitable.sh
Writing a unit-test for the kernel
Typically these can just be declared in the code using #[test]. Note that
tests by default will run under the unix platform. A small hack is necessary
to allow tests in the x86_64 to compile and run under unix too: When run on a
x86-64 unix platform, the platform specific code of the kernel in arch/x86_64/
will be included as a module named x86_64_arch whereas normally it would be
arch. This is a double-edged sword: we can now write tests that test the
actual bare-metal code (great), but we can also easily crash the test process by
calling an API that writes an MSR for example (e.g, things that would require
ring 0 priviledge level).
Writing an integration test for the kernel
Integration tests typically spawns a QEMU instance and beforehand compiles the kernel/user-space with a custom set of Cargo feature flags. Then it parses the qemu output to see if it gave the expected output. Part of those custom compile flags will also choose a different main() function than the one you're seeing (which will go off to load and schedule user-space programs for example).
There is two parts to the integration test.
- The host side (that will go off and spawn a qemu instance) for running the
integration tests. It is found in
kernel/tests. - The corresponding main functions in the kernel that gets executed for a
particular example are located at
kernel/src/integration_main.rs
To add a new integration test the following tests may be necessary:
- Modify
kernel/Cargo.tomlto add a feature (under[features]) for the test name. - Optional: Add a new
xmainfunction and test implementation in it tokernel/src/integration_main.rswith the used feature name as an annotation. It may also be possible to re-use an existing xmain function, in that case make not of the feature name used to include it. - Add a runner function to one of the files in
kernel/teststhat builds the kernel with the cargo feature runs it and checks the output.
Integration tests are divided into categories and named accordingly (partially to ensure the tests run in a sensible order):
s00_*: Core kernel functionality like boot-up and fault handlings01_*: Low level kernel services: SSE, memory allocation etc.s02_*: High level kernel services: ACPI, core booting mechanism, NR, VSpace etc.s03_*: High level kernel functionality: Spawn cores, run user-space programss04_*: User-space runtimess05_*: User-space applicationss06_*: Rackscale (distributed) tests
Benchmarks are named as such:
s10_*: User-space applications benchmarkss11_*: Rackscale (distributed) benchmarks
The s11_* benchmarks may be configured with two features:
baseline: Runs NrOS configured similarly to rackscale, for comparisonaffinity-shmem: Runs theivshmem-serverusing shmem with NUMA affinity. This option requires preconfiguring hugetlbfs withsudo hugeadm --create-global-mounts, having a kernel with 2MB huge pages enabled, and then also adding 1024 2MB pages per node, with a command like:echo <page-num> | sudo numactl -m <node-num> tee -a /proc/sys/vm/nr_hugepages_mempolicyThe number of huge pages per node may be verified withnumastat -m.
Network
nrk has support for three network interfaces at the moment: virtio, e1000 and
vmxnet3. virtio and e1000 are available by using the respective rumpkernel
drivers (and it's network stack). vmxnet3 is a standalone implementation that
uses smoltcp for the network stack and is also capable of running in ring 0.
Network Setup
The integration tests that run multiple instances of nrk require
bridged tap interfaces. For those integration tests, the test framework calls
run.py with the --network-only flag which will destroy existing conflicting
tap interfaces and create new tap interface(s) for the test based on the
number of hosts in the test. Then, to run the nrk instances, run.py is invoked
with the --no-network-setup flag.
To setup the network for a single client and server (--workers clients+server), run the following command:
python3 run.py --kfeatures integration-test --cmd "test=network_only" net --workers 2 --network-only
Ping
A simple check is to use ping (on the host) to test the network stack
functionality and latency. Adaptive ping -A, flooding ping -f are good modes
to see that the low-level parts of the stack work and can handle an "infinite"
amount of packets.
Some expected output if it's working:
$ ping 172.31.0.10
64 bytes from 172.31.0.10: icmp_seq=1 ttl=64 time=0.259 ms
64 bytes from 172.31.0.10: icmp_seq=2 ttl=64 time=0.245 ms
64 bytes from 172.31.0.10: icmp_seq=3 ttl=64 time=0.267 ms
64 bytes from 172.31.0.10: icmp_seq=4 ttl=64 time=0.200 ms
For network tests, it's easiest to start a DHCP server for the tap interface so the VM receives an IP by communicating with the server:
# Stop apparmor from blocking a custom dhcp instance
service apparmor stop
# Terminate any (old) existing dhcp instance
sudo  killall dhcpd
# Spawn a dhcp server, in the kernel/ directory do:
sudo dhcpd -f -d tap0 --no-pid -cf ./tests/dhcpd.conf
A fully automated CI test that checks the network using ping is available as well, it can be invoked with the following command:
RUST_TEST_THREADS=1 cargo test --test '*' -- s04_userspace_rumprt_net
socat and netcat
socat is a helpful utility on the host to interface with the network, for
example to open a UDP port and print on incoming packets on the command line,
the following command can be used:
socat UDP-LISTEN:8889,fork stdout
Similarly we can use netcat to connect to a port and send a payload:
nc 172.31.0.10 6337
The integration tests s05_redis_smoke and s04_userspace_rumprt_net make use
of those tool to verify that networking is working as expected.
tcpdump
tcpdump is another handy tool to see all packets that are exchanged on a given
interface etc. For debugging nrk network issues, this command is useful as it displays
all packets on tap0:
tcpdump -i tap0 -vvv -XX
Tracing
Use Intel PT (processor-trace). TBD.
Benchmarking
This chapter provides notes and pointers on how to set-up and run applications for benchmarking and run various OS micro-benchmarks.
Microbenchmarks
File-system
The code contains an implementation of the
fxmark
benchmark suite. The benchmark code is located at usr/init/src/fxmark.
To run the fxmark benchmarks invoke the following command:
RUST_TEST_THREADS=1 cargo test --test s10* -- s10_fxmark_bench --nocapture
fxmark supports several different file benchmarks:
- drbh: Read a shared block in a shared file
- drbl: Read a block in a private file.
- dwol: Overwrite a block in a private file.
- dwom: Overwrite a private block in a shared file.
- mwrl: Rename a private file in a private directory.
- mwrm: Move a private file to a shared directory.
- mix: Access/overwrite a random block (with fixed percentages) in a shared file.
By default the integration test might not run all benchmarks, you can modify the CI code to change what benchmarks are run or study it to determine how to supply the correct arguments to
run.py.
Address-space
The following integration tests benchmark the address-space in nrk:
-
s10_vmops_benchmark: This benchmark repeatedly inserts the same frame over and over in the process' address space, while varying the number of cores that do insertions. Every core works in its own partition of the address space. The system measures the throughput (operations per second). -
s10_vmops_latency_benchmark: Same ass10_vmops_benchmark, but measure latency instead of throughput. -
s10_vmops_unmaplat_latency_benchmark: The benchmark maps a frame in the address space, then spawns a series of threads on other cores that access the frame, afterwards it unmaps the frame and measures the latency of the unmap operation (the latency is dominated by completing the TLB shootdown protocol on all cores). -
s10_shootdown_simple: The benchmark measures the overhead in the kernel for programming the APIC and sending IPIs to initiate and complete the shootdown protocol.
The benchmark code is located at usr/init/src/vmops/. To invoke the
benchmarks, run:
RUST_TEST_THREADS=1 cargo test --test s10* -- s10_vmops_benchmark --nocapture
RUST_TEST_THREADS=1 cargo test --test s10* -- s10_vmops_latency_benchmark --nocapture
RUST_TEST_THREADS=1 cargo test --test s10* -- s10_vmops_unmaplat_latency_benchmark --nocapture
RUST_TEST_THREADS=1 cargo test --test s10* -- s10_shootdown_simple --nocapture
Network
TBD.
Benchmarking Redis
Redis is a simple, single-threaded key--value store written in C. It is a useful test to measure single-threaded performance of the system.
Automated integration tests
The easiest way to run redis on nrk, is to invoke the redis integration tests directly:
s05_redis_smokewill spawn nrk with a redis instance, connect to it usingncand issue a few commands to test basic functionality.s10_redis_benchmark_virtioands10_redis_benchmark_e1000will spawn nrk with a redis instance and launch theredis-benchmarkCLI tool on the host for benchmarking. The results obtained by redis-benchmark are parsed and written intoredis_benchmark.csv. Thevirtioande1000suffix indicate which network driver is used.
cd kernel
# Runs both _virtio and _e1000 redis benchmark tests
RUST_TEST_THREADS=1 cargo test --test s10* -- s10_redis_benchmark
Launch redis manually
You can also do the steps that the integration test does manually. We start a
DHCP server first. The apparmor teardown is necessary if you don't have a
security policy that allows the use of a dhcpd.conf at this location.
cd kernel
sudo service apparmor teardown
sudo dhcpd -f -d tap0 --no-pid -cf ./tests/dhcpd.conf
Next run the redis server in nrk (exchange the nic parameter with virtio to
use the virtio NIC):
python3 run.py \
  --kfeatures test-userspace \
  --nic e1000 \
  --cmd "log=info init=redis.bin" \
  --mods rkapps \
  --ufeatures "rkapps:redis" \
  --qemu-settings="-m 1024M"
Finally, execute the redis-benchmark on the host.
redis-benchmark -h 172.31.0.10 -n 10000000 -p 6379 -t get,set -P 29
You should see an output similar to this:
====== SET ======
  10000000 requests completed in 10.29 seconds
  50 parallel clients
  3 bytes payload
  keep alive: 1

0.31% <= 1 milliseconds
98.53% <= 2 milliseconds
99.89% <= 3 milliseconds
100.00% <= 4 milliseconds
100.00% <= 4 milliseconds
972100.75 requests per second

====== GET ======
  10000000 requests completed in 19.97 seconds
  50 parallel clients
  3 bytes payload
  keep alive: 1

0.14% <= 1 milliseconds
6.35% <= 2 milliseconds
77.66% <= 3 milliseconds
94.62% <= 4 milliseconds
97.04% <= 5 milliseconds
99.35% <= 6 milliseconds
99.76% <= 7 milliseconds
99.94% <= 8 milliseconds
99.99% <= 9 milliseconds
99.99% <= 10 milliseconds
100.00% <= 11 milliseconds
100.00% <= 11 milliseconds
500726.03 requests per second
redis-benchmark
redis-benchmark is a closed-loop benchmarking tool that ships with redis. You
can get it on Ubuntu by installing the redis-tools package:
sudo apt-get install redis-tools
Example invocation:
redis-benchmark -h 172.31.0.10 -t set,ping
For maximal throughput, use pipelining (-P), and the virtio network driver:
redis-benchmark -h 172.31.0.10 -n 10000000 -p 6379 -t get,set -P 29
Redis on Linux
You'll need a Linux VM image, see the Compare against Linux section for steps on how to create one.
Before starting the VM we can re-use the DHCP server config in
nrk/kernel/tests to start a DHCP server on the host that configures the
network of the guest VM:
# Launch a DHCP server (can reuse nrk config)
cd nrk/kernel
sudo dhcpd -f -d tap0 --no-pid -cf ./tests/dhcpd.conf
Next, start the VM. To have the same benchmarks conditions as nrk (e.g., use a tap device) launch the VM like this (select either e1000 or virtio, generally virtio will perform better than emulated e1000):
e1000 NIC:
qemu-system-x86_64 \
  --enable-kvm -m 2048 -k en-us --smp 2 \
  -boot d ubuntu-testing.img -nographic \
  -net nic,model=e1000,netdev=n0 \
  -netdev tap,id=n0,script=no,ifname=tap0
virtio NIC:
qemu-system-x86_64 \
  --enable-kvm -m 2048 -k en-us --smp 2 \
  -boot d ubuntu-testing.img -nographic \
  -net nic,model=virtio,netdev=n0 \
  -netdev tap,id=n0,script=no,ifname=tap0
Inside the Linux VM use the following steps to install redis:
sudo apt install vim git build-essential libjemalloc1 libjemalloc-dev net-tools
git clone https://github.com/antirez/redis.git
cd redis
git checkout 3.0.6
make
Finally, start redis:
cd redis/src
rm dump.rdb && ./redis-server
Some approximate numbers to expect on a Linux VM and Server CPUs:
e1000, no pipeline:
- SET 50k req/s
- GET 50k req/s
virtio, -P 29:
- SET 1.8M req/s
- GET 2.0M req/s
Redis on the rumprun unikernel
Install the toolchain:
git clone https://github.com/rumpkernel/rumprun.git rumprun
cd rumprun
# Rumprun install
git submodule update --init
./build-rr.sh hw -- -F CFLAGS='-w'
. "/root/rumprun/./obj-amd64-hw/config-PATH.sh"
Build the redis unikernel:
# Packages install
git clone https://github.com/gz/rumprun-packages.git
cd rumprun-packages

cp config.mk.dist config.mk
vim config.mk

cd redis
make -j8
rumprun-bake hw_generic redis.bin bin/redis-server
Run the unikernel
# Run using virtio
rumprun kvm -i -M 256 -I if,vioif,'-net tap,script=no,ifname=tap0'  -g '-curses'  -W if,inet,dhcp  -b images/data.iso,/data -- redis.bin
# Run using e1000
rumprun kvm -i -M 256 -I if,wm,'-net tap,ifname=tap0'  -g '-curses -serial -net nic,model=e1000'  -W if,inet,dhcp  -b images/data.iso,/data -- redis.bin
Run the benchmark
redis-benchmark -h 172.31.0.10
Approximate numbers to expect:
- virtio: PING ~100k req/s
- e1000 PING ~30k req/s
Benchmarking Memcached
Yet another key--value store written in C, but compared to Redis this one is multi-threaded.
Automated integration test
The easiest way to run memcached on nrk, is to invoke the integration test directly:
cd kernel
RUST_TEST_THREADS=1 cargo test --test s10* -- s10_memcached_benchmark
This test will spawn memcached on one, two and four threads and measure throughput and latency with memaslap.
Launch memcached manually
Start the server binary on the VM instance:
cd kernel
python3 run.py  \
    --kfeatures test-userspace-smp \
    --cmd 'log=info init=memcached.bin' \
    --nic virtio \
    --mods rkapps \
    --qemu-settings='-m 1024M' \
    --ufeatures 'rkapps:memcached' \
    --release \
    --qemu-cores 4 \
    --verbose
As usual, make sure dhcpd is running on the host:
cd kernel
sudo service apparmor teardown
sudo dhcpd -f -d tap0 --no-pid -cf ./tests/dhcpd.conf
Start the load-generater on the host:
memaslap -s 172.31.0.10 -t 10s -S 10s
memaslap: Load generator
memaslap measures throughput and latency of a memcached instance. You can invoke it like this:
memaslap -s 172.31.0.10:11211 -B -S 1s
Explanation of arguments:
-B: Use the binary protocol (faster than the ASCII variant)-S 1s: Dump statistics every X seconds
The other defaults arguments the tool assumes are:
- 8 client threads with concurrency of 128 sockets
- 1000000 requests
- SET proportion: 10%
- GET proportion: 90%
Unfortunately, the memaslap binary does not come with standard ubuntu packages. Follow the steps in the CI guide to install it from sources.
LevelDB
And, yet another key--value store written in C, but this one will also exercise the file-system (unlike and memcached or Redis).
Automated integration test
The easiest way to run LevelDB on nrk, is to invoke the integration test directly:
cd kernel
RUST_TEST_THREADS=1 cargo test --test s10* -- s10_leveldb_benchmark
This test will run the db-bench binary for LevelDB which runs various benchmarks directly in the LevelDB process. Our test is configured to create a database with 50k entries and a value size of 64 KiB, and then perform 100k random lookups. The benchmark is repeated while increasing the amount of cores/threads.
Launch dbbench manually
An example invocation to launch the db-bench binary directly through run.py:
python3 run.py --kfeatures test-userspace-smp \
    --cmd "log=info init=dbbench.bin initargs=28 appcmd=\'--threads=28 --benchmarks=fillseq,readrandom --reads=100000 --num=50000 --value_size=65535\'" \
    --nic virtio --mods rkapps --ufeatures rkapps:leveldb-bench \
    --release --qemu-cores 28 --qemu-nodes 2 --qemu-memory 81920 \
    --qemu-affinity --qemu-prealloc
dbbench example output
Running dbbench should ideally print an output similar to this:
LevelDB:    version 1.18
Keys:       16 bytes each
Values:     100 bytes each (50 bytes after compression)
Entries:    1000000
RawSize:    110.6 MB (estimated)
FileSize:   62.9 MB (estimated)
WARNING: Snappy compression is not enabled
------------------------------------------------
fillseq      :       1.810 micros/op;   61.1 MB/s
fillsync     :       0.000 micros/op;    inf MB/s (1000 ops)
fillrandom   :       1.350 micros/op;   81.9 MB/s
overwrite    :       2.620 micros/op;   42.2 MB/s
readrandom   :       0.000 micros/op; (1000000 of 1000000 found)
readrandom   :      10.440 micros/op; (1000000 of 1000000 found)
readseq      :       0.206 micros/op;  537.4 MB/s
readreverse  :       0.364 micros/op;  303.7 MB/s
compact      :   60000.000 micros/op;
readrandom   :       2.100 micros/op; (1000000 of 1000000 found)
readseq      :       0.190 micros/op;  582.1 MB/s
readreverse  :       0.301 micros/op;  367.7 MB/s
fill100K     :     390.000 micros/op;  244.6 MB/s (1000 ops)
crc32c       :       5.234 micros/op;  746.3 MB/s (4K per op)
snappycomp   :       0.000 micros/op; (snappy failure)
snappyuncomp :       0.000 micros/op; (snappy failure)
acquireload  :       0.000 micros/op; (each op is 1000 loads)
Build steps
Some special handling is currently encoded in the build-process. This is necessary because dbbench is a C++ program and C++ uses libunwind. However, we have a conflict here because Rust also uses libunwind and this leads to duplicate symbols because vibrio and the NetBSD C++ toolchain provide it (the non-hacky solution would probably be to always use the vibrio provided unwind symbols).
Implications:
- We have a
-L${RUMPRUN_SYSROOT}/../../obj-amd64-nrk/lib/libunwind/hack in the LevelDB Makefile ($CXXvariable) - We pass
-Wl,-allow-multiple-definitiontorumprun-bakesince unwind symbols are now defined twice (vibrio and NetBSD unwind lib)
See code in usr/rkapps/build.rs which adds flag for this case.
If you'll ever find yourself in a situation where you need to build LevelDB manually, (most likely not necessary except when debugging build), you can use the following steps:
cd nrk/target/x86_64-nrk-none/<release | debug>/build/rkapps-$HASH/out/leveldb
export PATH=`realpath ../../../rumpkernel-$HASH/out/rumprun/bin`:$PATH

RUMPRUN_TOOLCHAIN_TUPLE=x86_64-rumprun-netbsd make clean
RUMPRUN_TOOLCHAIN_TUPLE=x86_64-rumprun-netbsd make -j 12 TARGET_OS=NetBSD
RUMPBAKE_ENV="-Wl,-allow-multiple-definition" RUMPRUN_TOOLCHAIN_TUPLE=x86_64-rumprun-netbsd rumprun-bake nrk_generic ../../../../dbbench.bin bin/db_bench
You might also want to delete the
rm -rf buildandrm -rf litllines in the clean target of the Makefile if you want to call clean to recompile modified sources.
Run LevelDB on the rumprun unikernel
Build unikernel:
git clone https://github.com/rumpkernel/rumprun.git
cd rumprun
./build-rr.sh hw -- -F CFLAGS='-w'
. "/PATH/TO/config-PATH.sh"
Build LevelDB:
# Packages install
git clone https://github.com/gz/librettos-packages
cd librettos-packages/leveldb

RUMPRUN_TOOLCHAIN_TUPLE=x86_64-rumprun-netbsd make clean
RUMPRUN_TOOLCHAIN_TUPLE=x86_64-rumprun-netbsd make -j 12
RUMPRUN_TOOLCHAIN_TUPLE=x86_64-rumprun-netbsd rumprun-bake hw_virtio dbbench.bin bin/db_bench
Run it in a VM:
rm data.img
mkfs.ext2 data.img 512M
rumprun kvm -i -M 1024 -g '-nographic -display curses' -b data.img,/data -e TEST_TMPDIR=/data dbbench.bin
Artifact Evaluation
Thank you for your time and picking our paper for the artifact evaluation.
This file contains the steps to run experiments used in our OSDI'21 paper: NrOS: Effective Replication and Sharing in an Operating System.
All the experiments run smoothly on the c6420 CloudLab machine. There might be some issues if one tries to run the experiments on some other machine with a different configuration.
Reserve a cloudlab machine
Please follow the given steps to reserve a machine to run the experiments.
- Setup an account on CloudLab, if not already present.
- Log in to CloudLab and setup a password-less ssh key.
- Start an experiment by clicking on
Experimentson top left of the webpage. - Use the node type c6420 (by entrying
Optional physical node type- c6420), and setup the node with the Ubuntu 20.04 disk image.
Download the code and setup the environment
Download and checkout the sources:
cd $HOME
git clone https://github.com/vmware-labs/node-replicated-kernel.git nrk
cd nrk
git checkout osdi21-ae-v2
bash setup.sh
Configure the lab machine
Add password-less sudo capability for your user (scripts require it):
sudo visudo
# Add the following line at the bottom of the file:
$YOUR_USERNAME_HERE  ALL=(ALL) NOPASSWD: ALL
Add yourself to the KVM group:
sudo adduser $USER kvm
Disable apparmor, an annoying security feature that blocks the DHCP server from starting during testing. You can also set-up a rule to allowing this but it's easiest to just get rid of it on the test machine:
Most likely apparmor is not installed if you're using cloud-lab, in this case the commands will fail and you can ignore that.
sudo systemctl stop apparmor
sudo systemctl disable apparmor
sudo apt remove --assume-yes --purge apparmor
Unfortunately, for apparmor and kvm group changes to take effect, we need to reboot:
sudo reboot
Do a test run
Note: Most of our benchmarks takes a while to finish, so it is better to now switch to a tmux session, or increase the session timeout to avoid disconnects.
To check if the environment is setup properly, run
source $HOME/.cargo/env
cd $HOME/nrk/kernel
python3 ./run.py --release
The script downloads needed crates, compiles the OS and runs a basic test (the
run.py step can take a few minutes).
If everything worked, you should see the following last lines in your output:
[...]
[DEBUG] - init: Initialized logging
[DEBUG] - init: Done with init tests, if we came here probably everything is good.
[SUCCESS]
Figure 3: NR-FS vs. tmpfs
Please follow the given steps to reproduce Figure 3 in the paper.
NrFS results
To execute the benchmark, run:
RUST_TEST_THREADS=1 cargo test --test s10* -- s10_fxmark_bench --nocapture
The command runs all NR-FS microbenchmarks and stores the results in a CSV file
fxmark_benchmark.csv. This step can take a while (~30-60 min).
If everything worked, you should see an output like this one at the end:
[...]
Invoke QEMU: "python3" "run.py" "--kfeatures" "test-userspace-smp" "--cmd" "log=info initargs=32X8XmixX100" "--nic" "e1000" "--mods" "init" "--ufeatures" "fxmark" "--release" "--qemu-cores" "32" "--qemu-nodes" "2" "--qemu-memory" "49152" "--qemu-affinity"
Invoke QEMU: "python3" "run.py" "--kfeatures" "test-userspace-smp" "--cmd" "log=info initargs=32X12XmixX100" "--nic" "e1000" "--mods" "init" "--ufeatures" "fxmark" "--release" "--qemu-cores" "32" "--qemu-nodes" "2" "--qemu-memory" "49152" "--qemu-affinity"
Invoke QEMU: "python3" "run.py" "--kfeatures" "test-userspace-smp" "--cmd" "log=info initargs=32X16XmixX100" "--nic" "e1000" "--mods" "init" "--ufeatures" "fxmark" "--release" "--qemu-cores" "32" "--qemu-nodes" "2" "--qemu-memory" "49152" "--qemu-affinity"
ok

test result: ok. 1 passed; 0 failed; 0 ignored; 0 measured; 29 filtered out; finished in 2769.78s
Linux tmpfs results
You can also generate the tmpfs result on Linux:
cd $HOME
git clone https://github.com/gz/vmopsbench
cd vmopsbench
git checkout c011854
bash scripts/run.sh
The above command runs the benchmark and writes the results in a csv-file
fsops_benchmark.csv.
Plot Figure 3
All the plot scripts are in a github repository, execute the following to clone it.
cd $HOME
git clone https://github.com/ankit-iitb/plot-scripts.git
To install the required dependencies, run:
cd $HOME/plot-scripts
sudo apt install python3-pip
pip3 install -r requirements.txt
Plot the Figure 3 by running:
# python3 fsops_plot.py <Linux fsops csv> <NrOS fsops csv>
python3 fsops_plot.py $HOME/vmopsbench/fsops_benchmark.csv $HOME/nrk/kernel/fxmark_benchmark.csv
Arguments given in the plot scripts assume that the result files were not moved after the run. Please use the argument order given in the comment, if csv files were moved for some reason.
Figure 4: LevelDB
Figure 4 in the paper compares LevelDB workload performance for NR-FS and Linux-tmpfs.
LevelDB on NrOS
To run the LevelDB benchmark on NrOS execute:
cd $HOME/nrk/kernel
RUST_TEST_THREADS=1 cargo test --test s10* -- s10_leveldb_benchmark --nocapture
This step will take ~15-20min. If everything worked, you should see an output like this one at the end:
[...]
Invoke QEMU: "python3" "run.py" "--kfeatures" "test-userspace-smp" "--cmd" "log=info init=dbbench.bin initargs=32 appcmd=\'--threads=32 --benchmarks=fillseq,readrandom --reads=100000 --num=50000 --value_size=65535\'" "--nic" "virtio" "--mods" "rkapps" "--ufeatures" "rkapps:leveldb-bench" "--release" "--qemu-cores" "32" "--qemu-nodes" "2" "--qemu-memory" "81920" "--qemu-affinity" "--qemu-prealloc"
readrandom   : done: 3200000,  949492.348 ops/sec; (100000 of 50000 found)
ok

test result: ok. 1 passed; 0 failed; 0 ignored; 0 measured; 29 filtered out; finished in 738.67s
The command runs benchmarks and stores the results in a CSV file:
leveldb_benchmark.csv.
LevelDB on Linux
To run the LevelDB benchmark on Linux follow the steps below. Please clone the leveldb repository in a different path than NrOS.
cd $HOME
git clone https://github.com/amytai/leveldb.git
cd leveldb
git checkout 8af5ca6
bash run.sh
The above commands run the benchmarks and writes the results in a csv-file
linux_leveldb.csv.
Plot the LevelDB figure
Make sure that steps to download the plot scripts and install required dependencies have already been performed as explained in Plot Figure 3 before plotting Figure 4.
Run the following commands to plot the Figure 4.
cd $HOME/plot-scripts
# python3 leveldb_plot.py <Linux leveldb csv> <NrOS leveldb csv>
python3 leveldb_plot.py $HOME/leveldb/linux_leveldb.csv $HOME/nrk/kernel/leveldb_benchmark.csv
Figure 5 / 6a / 6c
Figure 5 in the paper compares address-space insertion throughput and latency for NR-VMem with Linux.
NR-VMem
To run the throughput benchmark (Figure 5) on NrOS execute:
cd $HOME/nrk/kernel
RUST_TEST_THREADS=1 cargo test --test s10* -- s10_vmops_benchmark --nocapture
This step will take ~3min. If everything worked, you should see an output like this one at the end:
Invoke QEMU: "python3" "run.py" "--kfeatures" "test-userspace-smp" "--cmd" "log=info initargs=32" "--nic" "e1000" "--mods" "init" "--ufeatures" "bench-vmops" "--release" "--qemu-cores" "32" "--qemu-nodes" "2" "--qemu-memory" "49152" "--qemu-affinity"
ok

test result: ok. 1 passed; 0 failed; 0 ignored; 0 measured; 29 filtered out; finished in 118.94s
The results will be stored in vmops_benchmark.csv.
To run the latency benchmark (Figure 6a) on NrOS execute:
RUST_TEST_THREADS=1 cargo test --test s10* -- s10_vmops_latency_benchmark --nocapture
This step will take ~2min. If everything worked, you should see an output like this one at the end:
Invoke QEMU: "python3" "run.py" "--kfeatures" "test-userspace-smp" "--cmd" "log=info initargs=32" "--nic" "e1000" "--mods" "init" "--ufeatures" "bench-vmops,latency" "--release" "--qemu-cores" "32" "--qemu-nodes" "2" "--qemu-memory" "32768" "--qemu-affinity"
ok

test result: ok. 1 passed; 0 failed; 0 ignored; 0 measured; 29 filtered out; finished in 106.67s
The results will be stored in vmops_benchmark_latency.csv.
To run the unmap latency benchmark (Figure 6c) on NrOS execute:
cd $HOME/nrk/kernel
RUST_TEST_THREADS=1 cargo test --test s10* -- s10_vmops_unmaplat_latency_benchmark --nocapture
This step will take ~2min. If everything worked, you should see an output like this one at the end:
Be aware unmap latency numbers might be impacted by the virtual execution of NrOS.
Invoke QEMU: "python3" "run.py" "--kfeatures" "test-userspace-smp" "--cmd" "log=info initargs=32" "--nic" "e1000" "--mods" "init" "--ufeatures" "bench-vmops-unmaplat,latency" "--release" "--qemu-cores" "32" "--qemu-nodes" "2" "--qemu-memory" "32768" "--qemu-affinity"
ok

test result: ok. 1 passed; 0 failed; 0 ignored; 0 measured; 29 filtered out; finished in 97.38s
The results will be stored in vmops_unmaplat_benchmark_latency.csv.
Linux VMem
To run the benchmark on Linux follow the steps below.
cd $HOME/vmopsbench
git checkout master
bash scripts/linux.bash throughput
bash scripts/linux.bash latency
bash scripts/linux-tlb.bash latency
The results for Figure 5, 6a, and 6c will be store in:
- Figure 5 in
vmops_linux_maponly-isolated-shared_threads_all_throughput_results.csv - Figure 6a in
Linux-Map_latency_percentiles.csv - Figure 6c in
Linux-Unmap_latency_percentiles.csv
Plot Figure 5 and 6a and 6c
Go to the plot-scripts repository:
cd $HOME/plot-scripts
Plot Figure 5:
# python3 vmops_throughput_plot.py  <linux vmops csv> <bespin vmops csv>
python3  vmops_throughput_plot.py  $HOME/vmopsbench/vmops_linux_maponly-isolated-shared_threads_all_throughput_results.csv $HOME/nrk/kernel/vmops_benchmark.csv
Plot Figure 6a:
# python3 map_latency_plot.py <linux map-latency csv> <bespin map-latency csv>
python3 map_latency_plot.py $HOME/vmopsbench/Linux-Map_latency_percentiles.csv $HOME/nrk/kernel/vmops_benchmark_latency.csv
Plot Figure 6c:
# python3 mapunmap_latency_plot.py <linux unmap-latency csv> <bespin unmap-latency csv>
python3 mapunmap_latency_plot.py $HOME/vmopsbench/Linux-Unmap_latency_percentiles.csv $HOME/nrk/kernel/vmops_unmaplat_benchmark_latency.csv
Baseline Operating Systems
Contains steps to get other operating systems compiled and running for comparison purposes.
Compare against Linux
To get an idea if nrk is competitive with Linux performance we can create a
Linux VM by creating an image. The following steps create an
ubuntu-testing.img disk-image by using the ubuntu-minimal installer:
wget http://archive.ubuntu.com/ubuntu/dists/bionic/main/installer-amd64/current/images/netboot/mini.iso
qemu-img create -f vmdk -o size=20G ubuntu-testing.img
kvm -m 2048 -k en-us --smp 2 --cpu host -cdrom mini.iso -hdd ubuntu-testing.img
# Follow installer instructions
Afterwards the image can be booted using kvm:
kvm -m 2048 -k en-us --smp 2 -boot d ubuntu-testing.img
Switch to serial output
One step that makes life easier is to enable to serial input/output. So we don't have to use a graphical QEMU interface. To enable serial, edit the grub configuration (/etc/default/grub) as follows in the VM:
GRUB_CMDLINE_LINUX_DEFAULT=""
GRUB_TERMINAL='serial console'
GRUB_CMDLINE_LINUX="console=tty0 console=ttyS0,115200n8"
GRUB_SERIAL_COMMAND="serial --speed=115200 --unit=0 --word=8 --parity=no --stop=1"
Then you must run update-grub to update the menu entries. From now on, you can
boot the VM using (not the -nographic option):
qemu-system-x86_64 --enable-kvm -m 2048 -k en-us --smp 2 -boot d ubuntu-testing.img -nographic
Compare against Barrelfish
TBD.
Compare against sv6
To clone & build the code (needs an older compiler version):
git clone https://github.com/aclements/sv6.git
sudo apt-get install gcc-4.8 g++-4.8
CXX=g++-4.8 CC=gcc-4.8 make
Update param.h:
QEMU       ?= qemu-system-x86_64 -enable-kvm
QEMUSMP    ?= 56
QEMUMEM    ?= 24000
Run:
CXX=g++-4.8 CC=gcc-4.8 make qemu`
Rackscale
One of the baselines for rackscale is NrOS. To run the rackscale benchmarks with corresponding NrOS baslines, run them with --feature baseline.
Environment
This chapter contains various notes on configuration and setup of the host system (Linux), and the hypervisor (QEMU) to use either pass-through or emulate various technologies for the nrkernel and develop for it.
Install QEMU from sources
Make sure the QEMU version for the account is is >= 6 . The following steps can be used to build it from scratch, if it the Ubuntu release has a lesser version in the package repository.
First, make sure to uncomment all #deb-src lines in /etc/apt/sources.list if not already uncommented. Then, run the following commands:
For any build:
sudo apt update
sudo apt install build-essential libpmem-dev libdaxctl-dev ninja-build flex bison
apt source qemu
sudo apt build-dep qemu
For non-rackscale:
wget https://download.qemu.org/qemu-6.0.0.tar.xz
tar xvJf qemu-6.0.0.tar.xz
cd qemu-6.0.0
For non-rackscale OR rackscale:
git clone https://github.com/hunhoffe/qemu.git qemu
cd qemu
git checkout --track origin/dev/ivshmem-numa
For any build:
./configure --enable-rdma --enable-libpmem
make -j 28
sudo make -j28 install
sudo make rdmacm-mux

# Check version (should be >=6.0.0)
qemu-system-x86_64 --version
You can also add --enable-debug to the configure script which will add debug
information (useful for source information when stepping through qemu code in
gdb).
Note that sometimes make install doesn't actually replace the
ivshmem-server. Use which ivshmem-server to find the current
location and then overwrite it with
qemu/build/contrib/ivshmem-server/ivshmem-server.
Use NVDIMM in QEMU
tldr: The
--qemu-pmemoption inrun.pywill add persistent memory to the VM. If you want to customize further, read on.
Qemu has support for NVDIMM that is provided by a memory-backend-file or memory-backend-ram. A simple way to create a vNVDIMM device at startup time is done via the following command-line options:
 -machine pc,nvdimm
 -m $RAM_SIZE,slots=$N,maxmem=$MAX_SIZE
 -object memory-backend-file,id=mem1,share=on,mem-path=$PATH,size=$NVDIMM_SIZE
 -device nvdimm,id=nvdimm1,memdev=mem1
Where,
-
the
nvdimmmachine option enables vNVDIMM feature. -
slots=$Nshould be equal to or larger than the total amount of normal RAM devices and vNVDIMM devices, e.g. $N should be >= 2 here. -
maxmem=$MAX_SIZEshould be equal to or larger than the total size of normal RAM devices and vNVDIMM devices. -
object memory-backend-file,id=mem1,share=on,mem-path=$PATH, size=$NVDIMM_SIZEcreates a backend storage of size$NVDIMM_SIZE. -
share=on/offcontrols the visibility of guest writes. Ifshare=on, then the writes from multiple guests will be visible to each other. -
device nvdimm,id=nvdimm1,memdev=mem1creates a read/write virtual NVDIMM device whose storage is provided by above memory backend device.
Guest Data Persistence
Though QEMU supports multiple types of vNVDIMM backends on Linux, the only backend that can guarantee the guest write persistence is:
- DAX device (e.g.,
/dev/dax0.0, ) or - DAX file(mounted with dax option)
When using DAX file (A file supporting direct mapping of persistent memory) as a
backend, write persistence is guaranteed if the host kernel has support for the
MAP_SYNC flag in the mmap system call and additionally, both 'pmem' and
'share' flags are set to 'on' on the backend.
NVDIMM Persistence
Users can provide a persistence value to a guest via the optional
nvdimm-persistence machine command line option:
-machine pc,accel=kvm,nvdimm,nvdimm-persistence=cpu
There are currently two valid values for this option:
mem-ctrl - The platform supports flushing dirty data from the memory
controller to the NVDIMMs in the event of power loss.
cpu - The platform supports flushing dirty data from the CPU cache to the
NVDIMMs in the event of power loss.
Emulate PMEM using DRAM
Linux systems allow emulating DRAM as PMEM. These devices are seen as the Persistent Memory Region by the OS. Usually, these devices are faster than actual PMEM devices and do not provide any persistence. So, such devices are used only for development purposes.
On Linux, to find the DRAM region that can be used as PMEM, use dmesg:
dmesg | grep BIOS-e820
The viable region will have "usable" word at the end.
[ 0.000000] BIOS-e820: [mem 0x0000000100000000-0x000000053fffffff] usable
This means that the memory region between 4 GiB (0x0000000100000000) and 21 GiB (0x000000053fffffff) is usable. Say we want to reserve a 16 GiB region starting from 4 GiB; we need to add this information to the grub configuration file.
sudo vi /etc/default/grub
GRUB_CMDLINE_LINUX="memmap=16G!4G"
sudo update-grub2
After rebooting with our new kernel parameter, the dmesg | grep user should
show a persistent memory region like the following:
[ 0.000000] user: [mem 0x0000000100000000-0x00000004ffffffff] persistent (type 12)
We will see this reserved memory range as /dev/pmem0. Now the emulated PMEM
region is ready to use. Mount it with the dax option.
sudo mkdir /mnt/pmem0
sudo mkfs.ext4 /dev/pmem0
sudo mount -o dax /dev/pmem0 /mnt/pmem0
Use it as a mem-path=/mnt/pmem0 as explained earlier.
Configure and Provision NVDIMMs
The NVDIMMs need to be configured and provisioned before using them for the
applications. Intel ipmctl tool can be used to discover and provision the
Intel PMs on a Linux machine.
To show all the NVDIMMs attached to the machine, run:
sudo ipmctl show -dimm
To show all the NVDIMMs attached on a socket, run:
sudo ipmctl show -dimm -socket SocketID
Provisioning
NVDIMMs can be configured both in volatile (MemoryMode) and non-volatile
(AppDirect) modes or a mix of two using ipmctl tool on Linux.
We are only interested in using the NVDIMMs in AppDirect mode. Even in AppDirect mode, the NVDIMMs can be configured in two ways; AppDirect and AppDirectNotInterleaved. In AppDirect mode, the data is interleaved across multiple DIMMs, and to use each NVDIMMs individually, AppDirectNotInterleaved is used. To configure multiple DIMMs in AppDirect interleaved mode, run:
sudo ipmctl create -goal PersistentMemoryType=AppDirect
Reboot the machine to reflect the changes made using the -goal command. The command creates a region on each socket on the machine.
ndctl show --regions
To show the DIMMs included in each region, run:
ndctl show --regions --dimms
Each region can be divided in one or more namespaces in order to show the storage devices in the operating system. To create the namespace(s), run:
sudo ndctl create-namespace --mode=[raw/sector/fsdax/devdax]
The namespace can be created in different modes like raw, sector, fsdax, and devdax. The default mode is fsdax.
Reboot the machine after creating the namespaces, and the devices will show-up in /dev/depending on the mode. For example, if the mode is fsdax, the devices will be named /dev/pmem.
Mount these devices:
sudo mkdir /mnt/pmem0
sudo mkfs.ext4 /dev/pmem0
sudo mount -o dax /dev/pmem0 /mnt/pmem0
These mount points can be used directly in the userspace applications or for Qemu virtual machine as explained earlier.
Use RDMA support in QEMU
tldr: The
-pvrdmaoption inrun.pywill enable RDMA support in QEMU. However, you'll manually have to runrdmacm-muxand unload the Mellanox modules at the moment.
QEMU has support for pvrdma (a para-virtual RDMA driver) which integrates with
physical cards (like Mellanox). In order to use it (aside from the
--enable-rdma flag and sudo make rdmacm-mux during building), the following
steps are necessary:
Install Mellanox drivers (or any other native drivers for your RDMA card):
wget https://content.mellanox.com/ofed/MLNX_OFED-5.4-1.0.3.0/MLNX_OFED_LINUX-5.4-1.0.3.0-ubuntu20.04-x86_64.tgz
tar zxvf MLNX_OFED_LINUX-5.4-1.0.3.0-ubuntu20.04-x86_64.tgz
cd MLNX_OFED_LINUX-5.4-1.0.3.0-ubuntu20.04-x86_64
./mlnxofedinstall --all
Before running the rdmacm-mux make sure that both ib_cm and rdma_cm kernel modules aren't loaded, otherwise the rdmacm-mux service will fail to start:
sudo rmmod ib_ipoib
sudo rmmod rdma_cm
sudo rmmod ib_cm
Start the QEMU racadm-mux utility (before launching a qemu VM that uses
pvrdma):
./rdmacm-mux -d mlx5_0 -p 0
Inter-VM Communication using Shared memory
tldr: Use the
--qemu-ivshmemand--qemu-shmem-pathoption inrun.pyto enable cross-VM shared-memory support in QEMU.
This section describes how to use shared memory to communicate between two Qemu VMs. First, create a shared memory file (with hugepages):
echo 1024 > /sys/kernel/mm/hugepages/hugepages-2048kB/nr_hugepages
sudo mkdir -p /mnt/hugepages
sudo mount -t hugetlbfs pagesize=2GB /mnt/huge
sudo chmod 777 /mnt/hugepages
Now, use a file on this mount point to create a shared memory file across two Qemu VMs. For shared memory, Qemu allows two types of configurations:
- Just the shared memory file:
ivshmem-plain. - Shared memory plus interrupts:
ivshmem-doorbell.
We use the plain shared memory configuration as the goal is to share memory across machines. Add the following parameters to the Qemu command line:
-object memory-backend-file,size=2G,mem-path=/mnt/hugepages/shmem-file,share=on,id=HMB \
-device ivshmem-plain,memdev=HMB
Discover the shared memory file inside Qemu
Qemu exposes the shared memory file to the kernel by creating a PCI device. Inside the VM, run the following command to discover to check if the PCI device is created or not.
lspci | grep "shared memory"
Running lspci should show something like:
00:04.0 RAM memory: Red Hat, Inc. Inter-VM shared memory (rev 01)
Use the lspci command to know more about the PCI device and BAR registers.
lspci -s 00:04.0 -nvv
This should print the BAR registers related information. The ivshmem PCI device has two to three BARs (depending on shared memory or interrupt device):
- BAR0 holds device registers (256 Byte MMIO)
- BAR1 holds MSI-X table and PBA (only ivshmem-doorbell)
- BAR2 maps the shared memory object
Since we are using the plain shared memory configuration, the BAR1 is not used. We only see the BAR0 and BAR2 as Region 0 and Region 1.
00:04.0 0500: 1af4:1110 (rev 01)
	Subsystem: 1af4:1100
	Physical Slot: 4
	Control: I/O+ Mem+ BusMaster- SpecCycle- MemWINV- VGASnoop- ParErr- Stepping- SERR+ FastB2B- DisINTx-
	Status: Cap- 66MHz- UDF- FastB2B- ParErr- DEVSEL=fast >TAbort- <TAbort- <MAbort- >SERR- <PERR- INTx-
	Region 0: Memory at febf1000 (32-bit, non-prefetchable) [size=256]
	Region 2: Memory at 280000000 (64-bit, prefetchable) [size=2G]
Use the shared memory file inside Qemu
If you only need the shared memory part, BAR2 suffices. This way, you have
access to the shared memory in the guest and can use it as you see fit. Region 2
in lspci output tells us that the shared memory is at 280000000 with the
size of 2G.
Here is a sample C program that writes to the shared memory file.
#include<stdio.h>
#include<stdint.h>
#include<unistd.h>
#include<fcntl.h>
#include<sys/mman.h>

int main() {
	void *baseaddr = (void *) 0x280000000; // BAR2 address
	uint64_t size = 2147483648; // BAR2 size

	int fd = open("/sys/bus/pci/devices/0000:00:04.0/resource2", O_RDWR | O_SYNC);
	void *retaddr = mmap(baseaddr, size, PROT_READ | PROT_WRITE, MAP_SHARED, fd, 0);
	if (addr == MAP_FAILED) {
		printf("mmap failed");
		return 0;
	}

	uint8_t *addr = (uint8_t *)retaddr;
	addr[0] = 0xa;

	munmap(retaddr, size);
	close(fd);
}
Compile and run the program (use sudo to run).
Perform the similar steps to read the shared memory file in another Qemu VM.
Discover CXL devices in Linux with Qemu
This document aims to list out steps to discover CXL type 3 devices inside the Linux kernel. Since there is no hardware available, the only way to achieve that is through Qemu emulation. Unfortunately, even the Qemu mainstream branch does not support these devices, so the tutorial uses a custom version of Qemu that supports CXL type 3 devices.
Build custom Qemu version
First, download and build the custom Qemu version on your machine.
sudo apt install build-essential libpmem-dev libdaxctl-dev ninja-build
cd ~/cxl
git clone https://gitlab.com/bwidawsk/qemu.git
cd qemu
git checkout cxl-2.0v4
./configure --enable-libpmem
make -j 16
Check the version:
./build/qemu-system-x86_64 --version
QEMU emulator version 6.0.50 (v6.0.0-930-g18395653c3)
Copyright (c) 2003-2021 Fabrice Bellard and the QEMU Project developers
Build custom Linux Kernel
Next, download the latest kernel version and build an image from the source.
cd ~/cxl
git clone https://git.kernel.org/pub/scm/linux/kernel/git/torvalds/linux.git
cd linux
make defconfig
defconfig generates default configuration values and stores them in the
.config file. The kernel requires some special configuration changes to handle
these devices. Only a few of these configuration flags are present in the
.config file, so do not worry if you cannot find all these flags.
CONFIG_ACPI_HMAT=y
CONFIG_ACPI_APEI_PCIEAER=y
CONFIG_ACPI_HOTPLUG_MEMORY=y
CONFIG_MEMORY_HOTPLUG=y
CONFIG_MEMORY_HOTPLUG_DEFAULT_ONLINE=y
CONFIG_MEMORY_HOTREMOVE=y
CONFIG_CXL_BUS=y
CONFIG_CXL_MEM=y
Once the configuration related changes are done, compile the kernel code to the generate the image file.
make -j 16
cd ~/cxl
The image file should be in linux/arch/x86_64/boot/bzImage.
Run Qemu with CXL related parameters
Qemu provides -kernel parameter to use the kernel image directly.
Let's try to use that -
qemu/build/qemu-system-x86_64 -kernel linux/arch/x86_64/boot/bzImage \
 -nographic -append "console=ttyS0" -m 1024 --enable-kvm
The kernel runs until it tries to find the root fs; then it crashes. One easy way to resolve this is to create a ramdisk.
mkinitramfs -o ramdisk.img
Press
Ctrl+aandcto exit kernel and then pressqto exit Qemu.
Now, run qemu with the newly created ramdisk:
qemu/build/qemu-system-x86_64 -kernel linux/arch/x86_64/boot/bzImage -nographic \
    -append "console=ttyS0" -m 1024 -initrd ramdisk.img --enable-kvm
The kernel runs properly this time. Now, it is time to add CXL related parameters before running Qemu:
qemu/build/qemu-system-x86_64 -kernel linux/arch/x86_64/boot/bzImage -nographic \
    -append "console=ttyS0" -initrd ramdisk.img -enable-kvm \
    -m 1024,slots=12,maxmem=16G -M q35,accel=kvm,cxl=on \
    -object memory-backend-file,id=cxl-mem1,share=on,mem-path=cxl-window1,size=512M \
 -object memory-backend-file,id=cxl-label1,share=on,mem-path=cxl-label1,size=1K \
 -object memory-backend-file,id=cxl-label2,share=on,mem-path=cxl-label2,size=1K \
 -device pxb-cxl,id=cxl.0,bus=pcie.0,bus_nr=52,uid=0,len-window-base=1,window-base[0]=0x4c00000000,memdev[0]=cxl-mem1 \
 -device cxl-rp,id=rp0,bus=cxl.0,addr=0.0,chassis=0,slot=0,port=0 \
 -device cxl-rp,id=rp1,bus=cxl.0,addr=1.0,chassis=0,slot=1,port=1 \
 -device cxl-type3,bus=rp0,memdev=cxl-mem1,id=cxl-pmem0,size=256M,lsa=cxl-label1 \
 -device cxl-type3,bus=rp1,memdev=cxl-mem1,id=cxl-pmem1,size=256M,lsa=cxl-label2
Qemu exposes the CXL devices to the kernel and the kernel discovers these devices. Verify the devices by running:
ls /sys/bus/cxl/devices/
or
dmesg | grep '3[45]:00'
References
Continuous integration (CI)
We run tests using the github-actions infrastructure. The following steps are necessary to set-up a new runner machine (and connect a github repo to it).
Steps to add a new CI machine:
- Install github-runner software on a new test machine
- Give access to the benchmark repository
- Configure software for the
github-runneraccount - Disable AppArmor
- Install a recent QEMU
- Do a test-run
- Start the new runner
Install github-runner software on a new test machine
Create a github-runner user first:
sudo useradd github-runner -m -s /bin/zsh
Add sudo capability for github-runner:
sudo visudo
# github-runner  ALL=(ALL) NOPASSWD: ALL
For better security with self-hosted code exeuction, make sure to enable
Settings -> Actions -> Runners -> Require approval for all outside collaboratorsin the github repo settings!
Other than that, follow the steps listed under Settings -> Actions -> Runner -> Add runner:
sudo su github-runner
cd $HOME
<< steps from Web-UI >>
When asked for labels, make sure to give it a machine specific tag. For example,
we currenly use the following labels skylake2x, skylake4x, cascadelake2x,
ryzen5 to indicate different machine type and the number of sockets/NUMA
nodes. Machines with identical hardware should have the same tag to allow
parallel test execution.
If you add a new machine label, make sure to also add it to
utils.pyin the CI website_scriptsfolder.
Don't launch the runner yet with run.sh (this happens further below in the doc).
Give access to the benchmark repository
Benchmark results are uploaded automatically to git.
Generate a key for accessing the repository or use an existing key on the github-runner account. Also add the user to the KVM group. Adding yourself to the KVM group requires a logout/reboot which we do in later steps.
sudo adduser github-runner kvm
ssh-keygen
Then, add the pub key (.ssh/id_rsa.pub) to the github CI account.
Configure software for the github runner account
Install necessary software for use by the runner:
git clone git@github.com:vmware-labs/node-replicated-kernel.git nrk
cd nrk/
bash setup.sh
source $HOME/.cargo/env
Install a recent qemu
Follow the steps in the Environment chapter.
Install memaslap
The memcached benchmark uses the memaslap binary that comes with
libmemcached but is not included in the Ubuntu libmemcached-tools deb package.
You'll have to install it manually from the sources:
cd $HOME
sudo apt-get build-dep libmemcached-tools
wget https://launchpad.net/libmemcached/1.0/1.0.18/+download/libmemcached-1.0.18.tar.gz
tar zxvf libmemcached-1.0.18.tar.gz

cd libmemcached-1.0.18/
LDFLAGS='-lpthread' CPPFLAGS='-fcommon -fpermissive' CFLAGS='-fpermissive -fcommon' ./configure --enable-memaslap
CPPFLAGS='-fcommon' make -j12
sudo make install
sudo ldconfig

which memaslap
Disable AppArmor
An annoying security feature that blocks our DHCP server from starting for testing. You can set-up a rule for allowing this but it's easiest to just get rid of it on the CI machine:
sudo systemctl stop apparmor
sudo systemctl disable apparmor
sudo apt remove --assume-yes --purge apparmor
# Unfortunately for apparmor and kvm group changes to take effect, we need to reboot:
sudo reboot
Do a test-run
After the reboot, verify that the nrk tests pass (this will take a while, but if it works CI will likely succeed too):
# Init submodules if not done so already:
cd nrk
git submodule update --init
source $HOME/.cargo/env

cd kernel
RUST_TEST_THREADS=1 cargo test --features smoke -- --nocapture
Start the runner
Finally, launch the runner:
cd $HOME/actions-runner
source $HOME/.cargo/env
./run.sh
Start runner as systemd service
cd $HOME/actions-runner
sudo ./svc.sh install
sudo ./svc.sh start
Check the runner status with:
sudo ./svc.sh status
Stop the runner with:
sudo ./svc.sh stop
Uninstall the service with:
sudo ./svc.sh uninstall
Repository settings
If the repo is migrated to a new location, the following settings should be mirrored:
- Under Settings -> Secrets: Add secret
WEBSITE_DEPLOY_SSH_KEYwhich contains a key to push the generated documentation to the correct website repository. - Under Settings -> Options: Disable "Allow merge commits"
- Under Settings -> Branches: Add branch protection for
master, enable the following settings:- Require pull request reviews before merging
- Dismiss stale pull request approvals when new commits are pushed
- Require status checks to pass before merging
- Require branches to be up to date before merging
- Require linear history
- Under Settings -> Actions -> Runners:
- "Require approval for all outside collaborators"
Related Work
NRK takes inspiration from decades of academic research. The following list is by no means exhaustive:
Operating Systems
Scalable Data structures
Log based designs
Contributors
Here is a list of the contributors who helped to build NRK. Big shout-out to them!
- Amy Tai
- Ankit Bhardwaj
- Chinmay Kulkarni
- Christian Menges
- Erika Hunhoff
- Gerd Zellweger
- Irina Calciu
- Reto Achermann
- Ryan Stutsman
- Sanidhya Kashyap
- Stanko Novakovic
- Zack McKevitt
If you feel you're missing from this list, feel free to add yourself in a PR.